
Q1 2024 Update Exhibit 99.1
Highlights 03�Financial Summary 04�Operational Summary 06�Vehicle Capacity 07�Core Technology 08�Other Highlights 09�Outlook 10�Photos & Charts 11�Key Metrics 22�Financial Statements 24�Additional Information 30
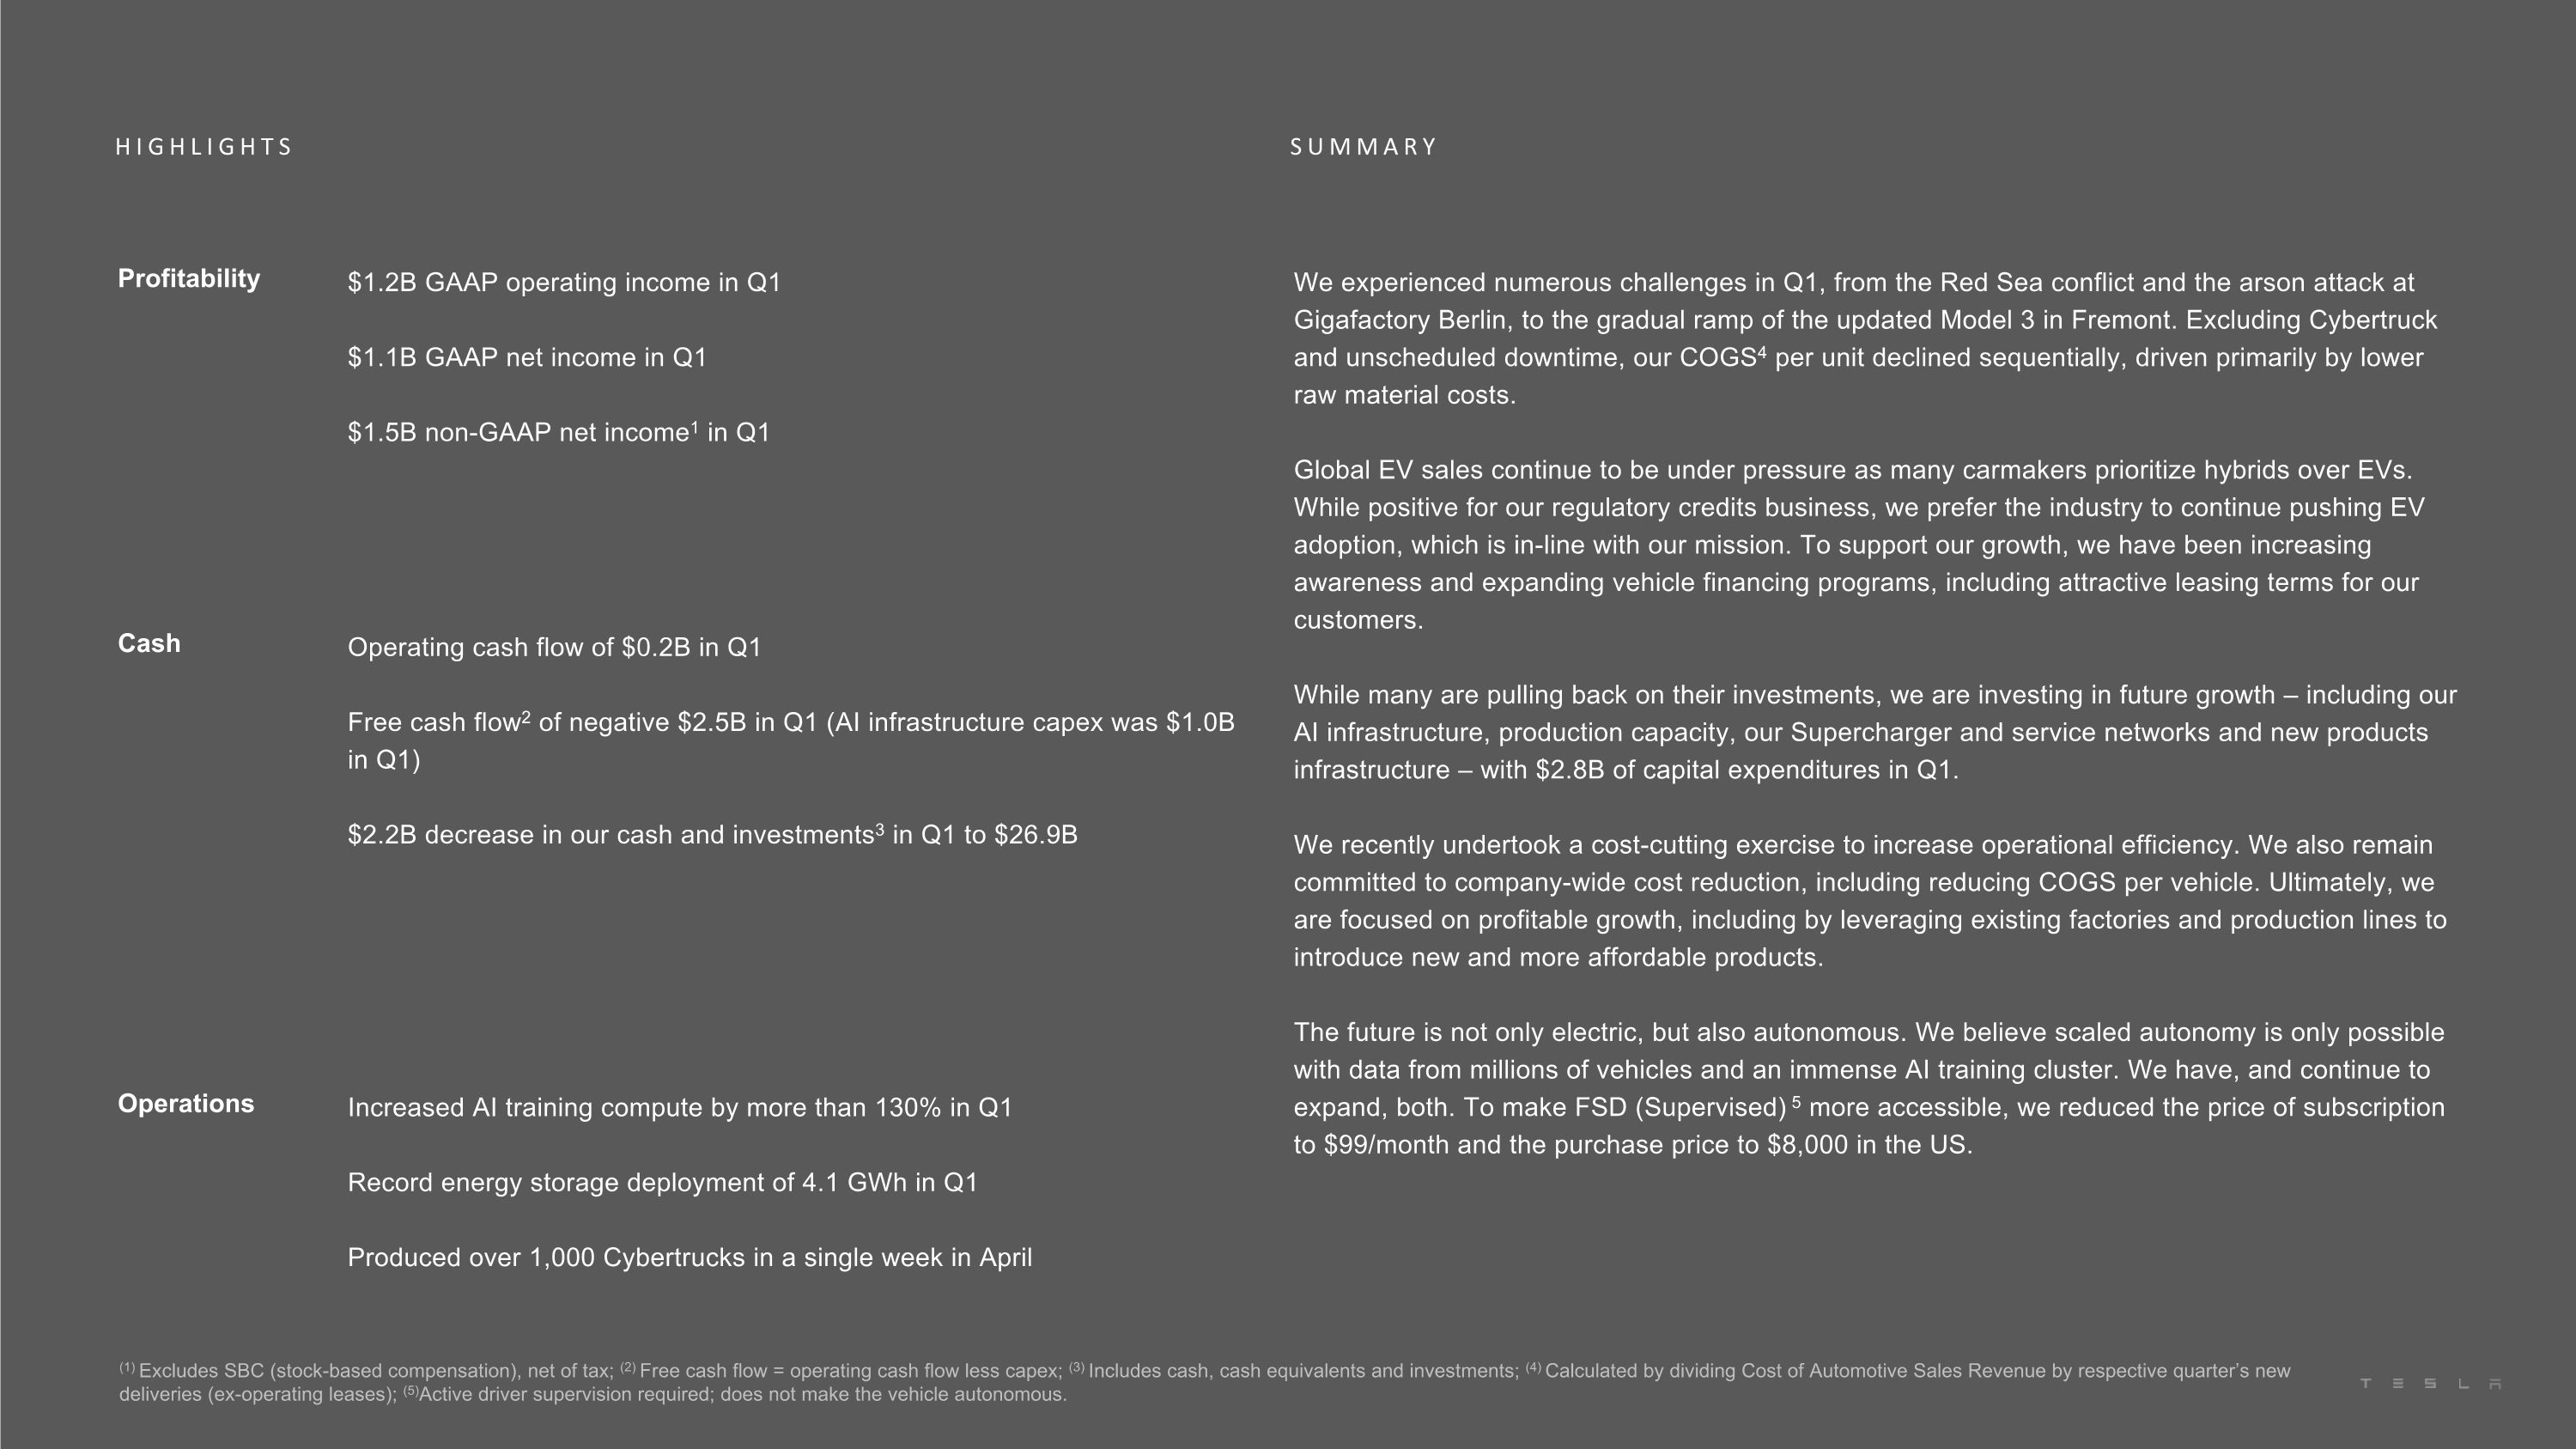
S U M M A R Y H I G H L I G H T S (1) Excludes SBC (stock-based compensation), net of tax; (2) Free cash flow = operating cash flow less capex; (3) Includes cash, cash equivalents and investments; (4) Calculated by dividing Cost of Automotive Sales Revenue by respective quarter’s new deliveries (ex-operating leases); (5)Active driver supervision required; does not make the vehicle autonomous. Profitability $1.2B GAAP operating income in Q1 $1.1B GAAP net income in Q1 $1.5B non-GAAP net income1 in Q1 We experienced numerous challenges in Q1, from the Red Sea conflict and the arson attack at Gigafactory Berlin, to the gradual ramp of the updated Model 3 in Fremont. Excluding Cybertruck and unscheduled downtime, our COGS4 per unit declined sequentially, driven primarily by lower raw material costs. Global EV sales continue to be under pressure as many carmakers prioritize hybrids over EVs. While positive for our regulatory credits business, we prefer the industry to continue pushing EV adoption, which is in-line with our mission. To support our growth, we have been increasing awareness and expanding vehicle financing programs, including attractive leasing terms for our customers. While many are pulling back on their investments, we are investing in future growth – including our AI infrastructure, production capacity, our Supercharger and service networks and new products infrastructure – with $2.8B of capital expenditures in Q1. We recently undertook a cost-cutting exercise to increase operational efficiency. We also remain committed to company-wide cost reduction, including reducing COGS per vehicle. Ultimately, we are focused on profitable growth, including by leveraging existing factories and production lines to introduce new and more affordable products. The future is not only electric, but also autonomous. We believe scaled autonomy is only possible with data from millions of vehicles and an immense AI training cluster. We have, and continue to expand, both. To make FSD (Supervised) 5 more accessible, we reduced the price of subscription to $99/month and the purchase price to $8,000 in the US. Cash Operating cash flow of $0.2B in Q1 Free cash flow2 of negative $2.5B in Q1 (AI infrastructure capex was $1.0B in Q1) $2.2B decrease in our cash and investments3 in Q1 to $26.9B Operations Increased AI training compute by more than 130% in Q1 Record energy storage deployment of 4.1 GWh in Q1 Produced over 1,000 Cybertrucks in a single week in April

F I N A N C I A L S U M M A R Y (Unaudited) ($ in millions, except percentages and per share data) Q1-2023 Q2-2023 Q3-2023 Q4-2023 Q1-2024 YoY Total automotive revenues 19,963 21,268 19,625 21,563 17,378 -13% Energy generation and storage revenue 1,529 1,509 1,559 1,438 1,635 7% Services and other revenue 1,837 2,150 2,166 2,166 2,288 25% Total revenues 23,329 24,927 23,350 25,167 21,301 -9% Total gross profit 4,511 4,533 4,178 4,438 3,696 -18% Total GAAP gross margin 19.3% 18.2% 17.9% 17.6% 17.4% -199 bp Operating expenses 1,847 2,134 2,414 2,374 2,525 37% Income from operations 2,664 2,399 1,764 2,064 1,171 -56% Operating margin 11.4% 9.6% 7.6% 8.2% 5.5% -592 bp Adjusted EBITDA 4,267 4,653 3,758 3,953 3,384 -21% Adjusted EBITDA margin 18.3% 18.7% 16.1% 15.7% 15.9% -240 bp Net income attributable to common stockholders (GAAP) 2,513 2,703 1,853 7,928 1,129 -55% Net income attributable to common stockholders (non-GAAP) 2,931 3,148 2,318 2,485 1,536 -48% EPS attributable to common stockholders, diluted (GAAP) 0.73 0.78 0.53 2.27 0.34 -53% EPS attributable to common stockholders, diluted (non-GAAP) 0.85 0.91 0.66 0.71 0.45 -47% Net cash provided by operating activities 2,513 3,065 3,308 4,370 242 -90% Capital expenditures (2,072) (2,060) (2,460) (2,306) (2,773) 34% Free cash flow 441 1,005 848 2,064 (2,531) -674% Cash, cash equivalents and investments 22,402 23,075 26,077 29,094 26,863 20%
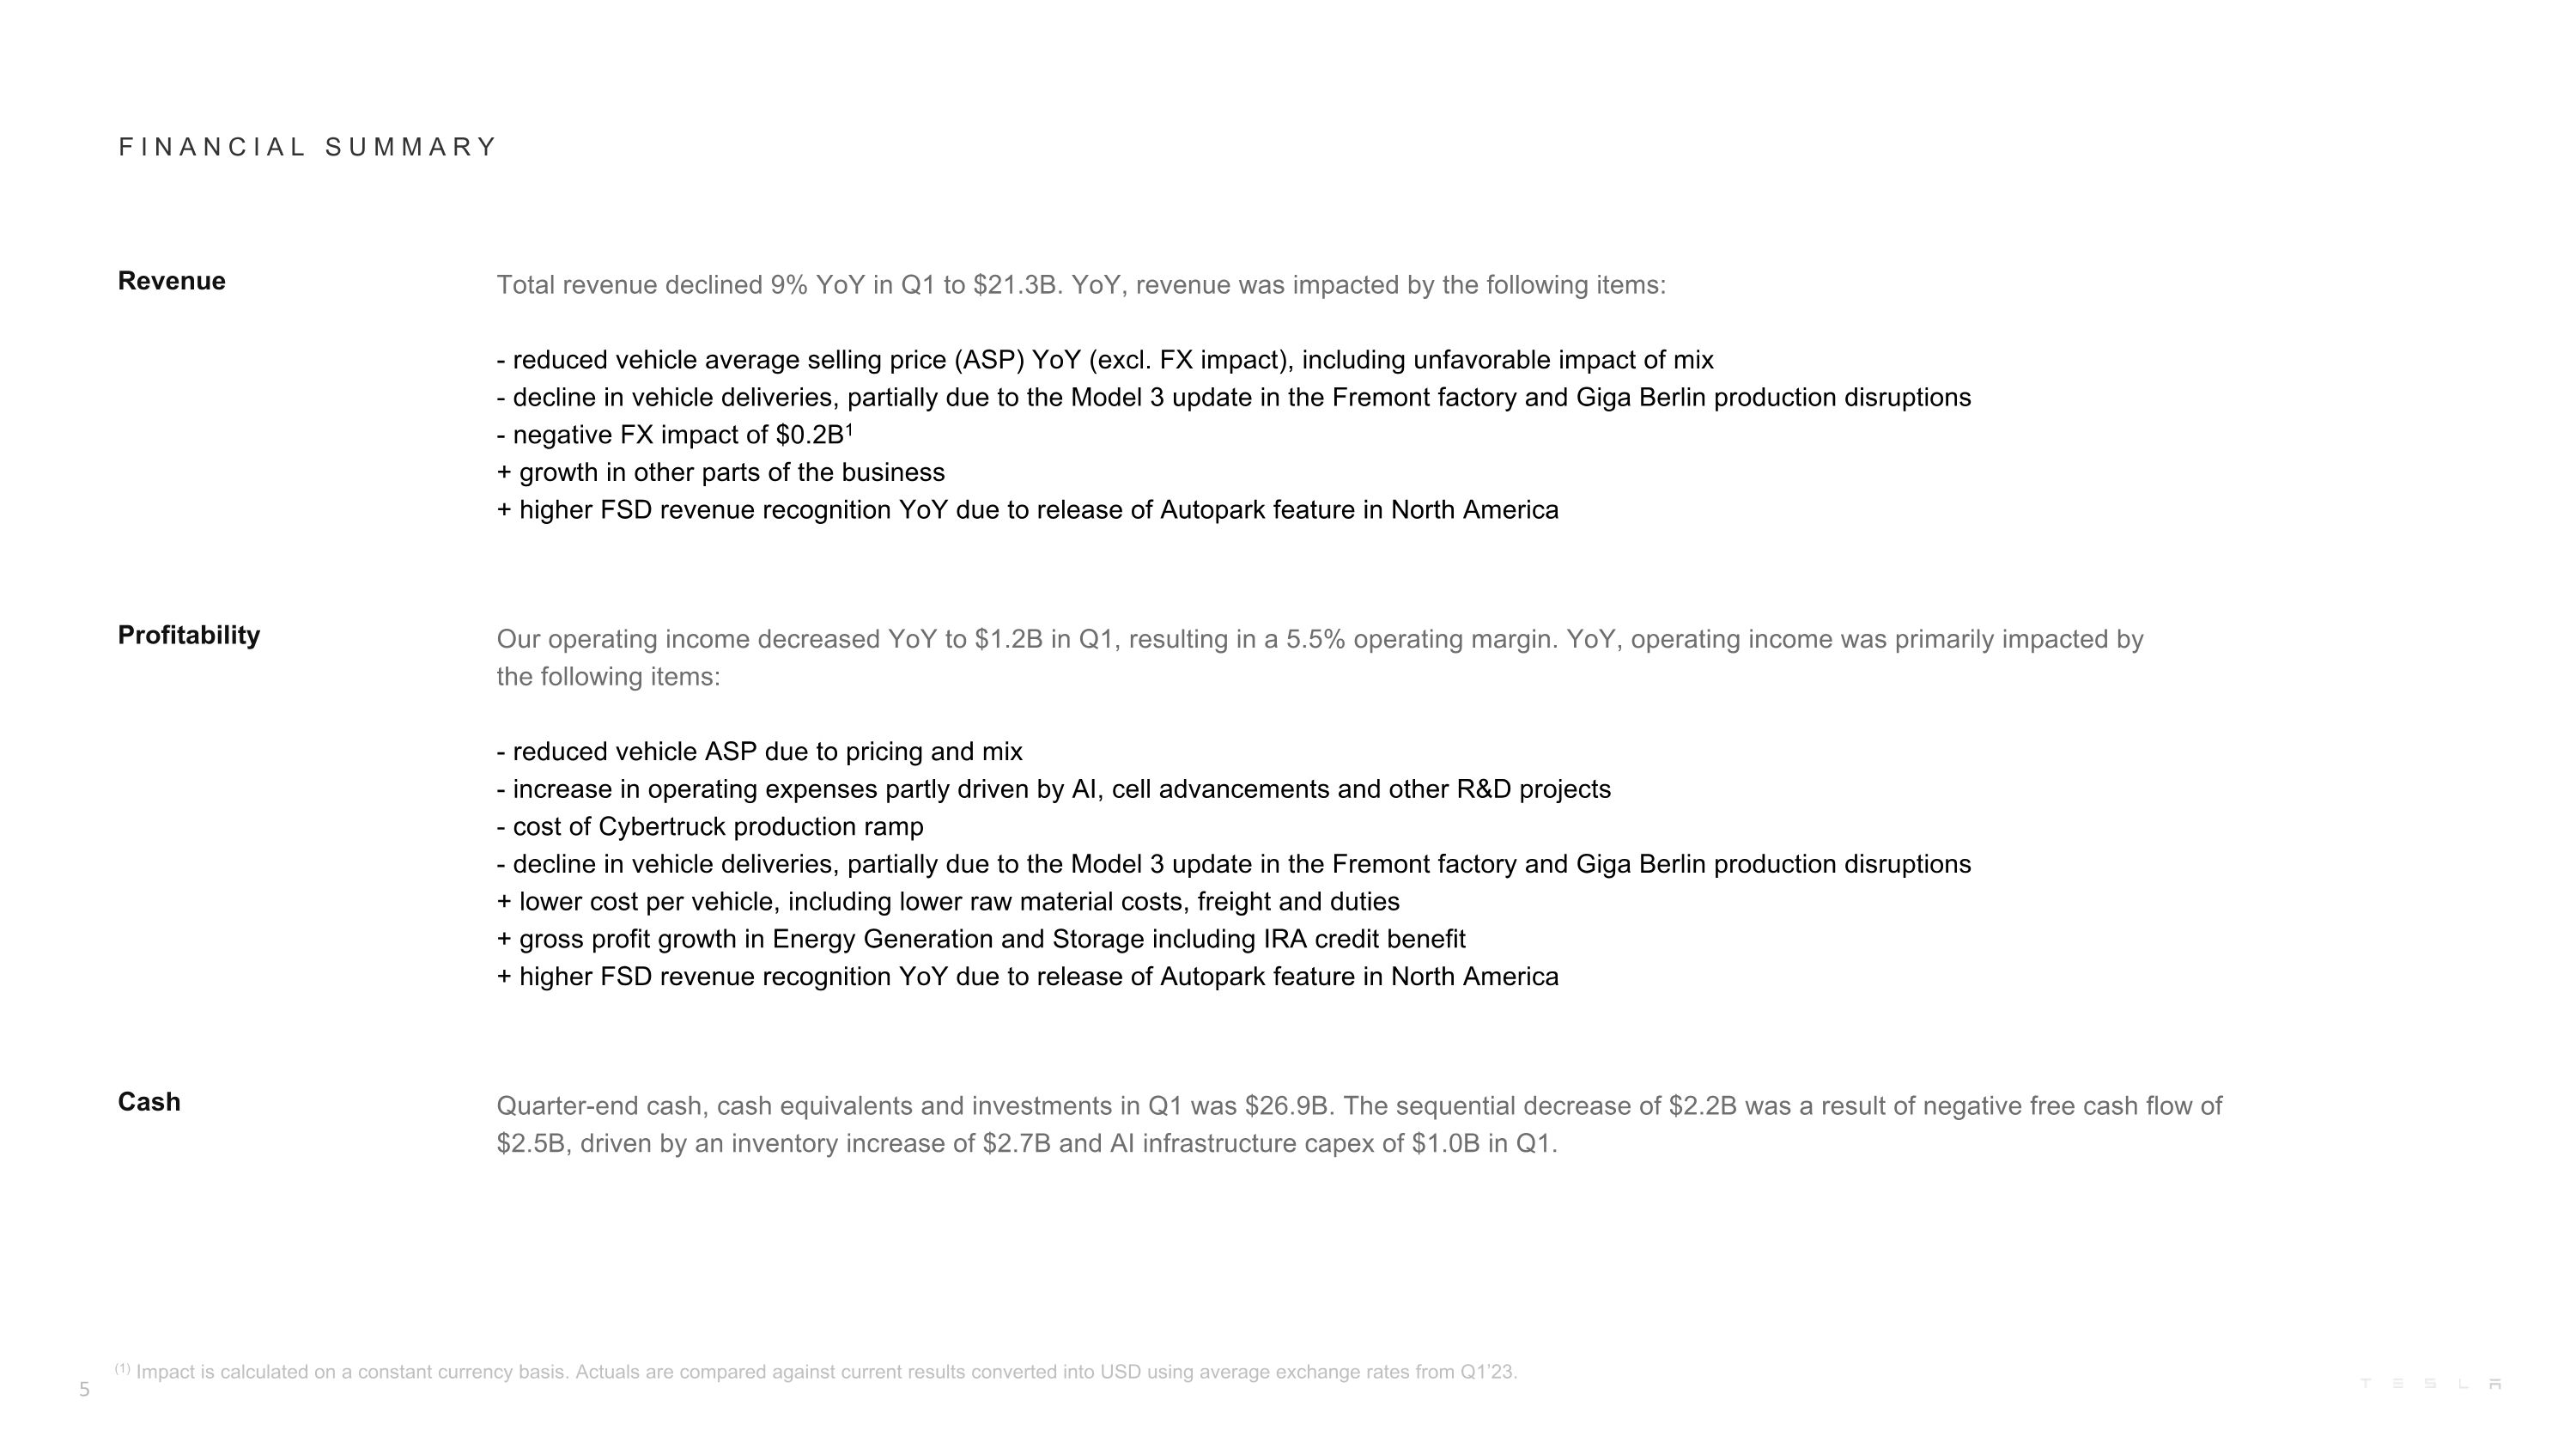
F I N A N C I A L S U M M A R Y Revenue Total revenue declined 9% YoY in Q1 to $21.3B. YoY, revenue was impacted by the following items: - reduced vehicle average selling price (ASP) YoY (excl. FX impact), including unfavorable impact of mix - decline in vehicle deliveries, partially due to the Model 3 update in the Fremont factory and Giga Berlin production disruptions - negative FX impact of $0.2B1 + growth in other parts of the business + higher FSD revenue recognition YoY due to release of Autopark feature in North America Profitability Our operating income decreased YoY to $1.2B in Q1, resulting in a 5.5% operating margin. YoY, operating income was primarily impacted by the following items: - reduced vehicle ASP due to pricing and mix - increase in operating expenses partly driven by AI, cell advancements and other R&D projects - cost of Cybertruck production ramp - decline in vehicle deliveries, partially due to the Model 3 update in the Fremont factory and Giga Berlin production disruptions + lower cost per vehicle, including lower raw material costs, freight and duties + gross profit growth in Energy Generation and Storage including IRA credit benefit + higher FSD revenue recognition YoY due to release of Autopark feature in North America Cash Quarter-end cash, cash equivalents and investments in Q1 was $26.9B. The sequential decrease of $2.2B was a result of negative free cash flow of $2.5B, driven by an inventory increase of $2.7B and AI infrastructure capex of $1.0B in Q1. (1) Impact is calculated on a constant currency basis. Actuals are compared against current results converted into USD using average exchange rates from Q1’23.

Q1-2023 Q2-2023 Q3-2023 Q4-2023 Q1-2024 YoY Model 3/Y production 421,371 460,211 416,800 476,777 412,376 -2% Other models production 19,437 19,489 13,688 18,212 20,995 8% Total production 440,808 479,700 430,488 494,989 433,371 -2% Model 3/Y deliveries 412,180 446,915 419,074 461,538 369,783 -10% Other models deliveries 10,695 19,225 15,985 22,969 17,027 59% Total deliveries 422,875 466,140 435,059 484,507 386,810 -9% of which subject to operating lease accounting 22,357 21,883 17,423 10,563 8,365 -63% Total end of quarter operating lease vehicle count 153,988 168,058 176,231 176,564 173,131 12% Global vehicle inventory (days of supply)(1) 15 16 16 15 28 87% Storage deployed (MWh) 3,889 3,653 3,980 3,202 4,053 4% Tesla locations 1,000 1,068 1,129 1,208 1,258 26% Mobile service fleet 1,692 1,769 1,846 1,909 1,897 12% Supercharger stations 4,947 5,265 5,595 5,952 6,249 26% Supercharger connectors 45,169 48,082 51,105 54,892 57,579 27% (1)Days of supply is calculated by dividing new vehicle ending inventory by the relevant quarter’s deliveries and using 75 trading days (aligned with Automotive News definition). O P E R A T I O N A L S U M M A R Y (Unaudited)

V E H I C L E C A P A C I T Y Current Installed Annual Vehicle Capacity Current Status Region Model Capacity Status California Model S / Model X 100,000 Production Model 3 / Model Y >550,000 Production Shanghai Model 3 / Model Y >950,000 Production Berlin Model Y >375,000 Production Texas Model Y >250,000 Production Cybertruck >125,000 Production Nevada Tesla Semi - Pilot production Various Next Gen Platform - In development TBD Roadster - In development Installed capacity ≠ current production rate and there may be limitations discovered as production rates approach capacity. Production rates depend on a variety of factors, including equipment uptime, component supply, downtime related to factory upgrades, regulatory considerations and other factors. Market share of Tesla vehicles by region (TTM) Source: Tesla estimates based on latest available data from ACEA; Autonews.com; CAAM – light-duty vehicles only; TTM = Trailing twelve months A sequential decline in volumes was partially caused by the early phase of the production ramp of the updated Model 3 at our Fremont factory and factory shutdowns at Gigafactory Berlin resulting from shipping diversions caused by the Red Sea conflict and from an arson attack. US: California, Nevada and Texas Model 3 production in Fremont was down sequentially as we changed the production line to the updated model. Sequentially, Model Y production at Gigafactory Texas increased to an all-time high, while COGS per unit improved to an all-time low. The Cybertruck ramp continued successfully at Gigafactory Texas, with a sequential cost improvement in Q1. We produced over 1,000 Cybertrucks in a single week in April. China: Shanghai Production at Gigafactory Shanghai was down sequentially due to seasonality and planned shutdowns around Chinese New Year in Q1. Demand typically improves throughout the year. As we enter new markets, such as Chile, many of them will be supplied from Gigafactory Shanghai. Europe: Berlin-Brandenburg Model Y production in Berlin was down sequentially due to impacts from the Red Sea conflict and the arson attack that impacted the factory. Despite idle capacity charges and other costs from production disruptions, COGS per unit continued to decline sequentially.

Tesla AI Training Capacity (H100 Equivalent GPUs) C O R E T E C H N O L O G Y Cumulative miles driven with FSD Beta (billions; as of Apr-21-24) Artificial Intelligence Software and Hardware We have been investing in the hardware and software ecosystems necessary to achieve vehicle autonomy and a ride-hailing service. We believe a scalable and profitable autonomy business can be realized through a vision-only architecture with end-to-end neural networks, trained on billions of miles of real-world data. Since the launch of FSD (Supervised) V12 earlier this year, it has become clear that this architecture long pursued by Tesla is the right solution for scalable autonomy. To further improve our end-to-end training capability, we will continue to increase our core AI infrastructure capacity in the coming months. In Q1, we completed the transition to Hardware 4.0, our latest in-vehicle computer with increased inference processing power and improved cameras. Vehicle and Other Software We rolled out FSD (Supervised) with a 30-day free trial to eligible cars in U.S. and Canada. FSD (Supervised) can change lanes, select forks to follow routes, navigate around vehicles and objects and make turns. We released Autopark to existing eligible FSD (Supervised) and Enhanced Autopilot customers. We are currently working on ride-hailing functionality that will be available in the future. We believe the Tesla software experience is best-in-class across all our products, and plan to seamlessly layer ride-hailing into the Tesla App. Battery, Powertrain & Manufacturing 4680 ramp continued successfully in Q1 and continues to stay ahead of the Cybertruck ramp. Costs continued to come down sequentially as scrap, yield and production rate improved.

O T H E R H I G H L I G H T S Energy Storage deployments (GWh) Non-Automotive gross profit ($M) Our non-automotive business is becoming an increasingly profitable part of Tesla. As Megapack continues to ramp and as our fleet continues to grow, we are expecting consistent profit growth of our non-automotive business. Energy Generation and Storage Energy storage deployments increased sequentially in Q1 to a record 4.1 GWh. Energy Generation and Storage revenue and gross profit also achieved an all-time high in Q1. Revenues were up 7% YoY and gross profit was up 140% YoY, driven by increased Megapack deployments, partially offset by a decrease in solar deployments. Energy Generation and Storage remains our highest margin business. Our second general assembly line is now commissioned, and we continue to ramp our 40 GWh Megafactory in Lathrop, CA toward full capacity. Services and Other Services and Other revenue grew 25% YoY in Q1, while gross profit was down 40% YoY. The biggest driver of gross profit reduction YoY was lower used vehicle profit, partially offset by growth in gross profit from part sales. Starting at the end of February, we began opening our North American Supercharger Network to more non-Tesla EV owners. We will continue to onboard OEMs who have committed to NACS over the coming quarters, while also opening more sites to other EVs in regions outside North America, both of which should drive incremental revenue and profit generation.

O U T L O O K Volume Our company is currently between two major growth waves: the first one began with the global expansion of the Model 3/Y platform and we believe the next one will be initiated by advances in autonomy and introduction of new products, including those built on our next generation vehicle platform. In 2024, our vehicle volume growth rate may be notably lower than the growth rate achieved in 2023, as our teams work on the launch of the next generation vehicle and other products. In 2024, the growth rates of energy storage deployments and revenue in our Energy Generation and Storage business should outpace the Automotive business. Cash We have sufficient liquidity to fund our product roadmap, long-term capacity expansion plans and other expenses. Furthermore, we will manage the business such that we maintain a strong balance sheet during this uncertain period. Profit While we continue to execute on innovations to reduce the cost of manufacturing and operations, over time, we expect our hardware-related profits to be accompanied by an acceleration of AI, software and fleet-based profits. Product We have updated our future vehicle line-up to accelerate the launch of new models ahead of our previously communicated start of production in the second half of 2025. These new vehicles, including more affordable models, will utilize aspects of the next generation platform as well as aspects of our current platforms, and will be able to be produced on the same manufacturing lines as our current vehicle line-up. This update may result in achieving less cost reduction than previously expected but enables us to prudently grow our vehicle volumes in a more capex efficient manner during uncertain times. This would help us fully utilize our current expected maximum capacity of close to three million vehicles, enabling more than 50% growth over 2023 production before investing in new manufacturing lines. Our purpose-built robotaxi product will continue to pursue a revolutionary “unboxed” manufacturing strategy.

P H O T O S & C H A R T S

E L E C T R I C V E H I C L E A D O P T I O N R A T E R E M A I N S U N D E R P R E S S U R E , E S P E C I A L L Y O U T S I D E O F C H I N A Global BEV market share* (12-months trailing) China World ex-China *Source: ev-volumes.com and https://www.renaultgroup.com/en/finance-2/key-figures/monthly-sales/

T H E T E S L A E C O S Y S T E M - M O R E T H A N J U S T V E H I C L E S

M O D E L 3 - S T A R T I N G A T $ 2 9 9 / M O I N T H E U . S . ( $ 1 6 0 / M O A F T E R P R O B A B L E G A S S A V I N G S)

C Y B E R T R U C K - F I N A L A S S E M B L Y L I N E
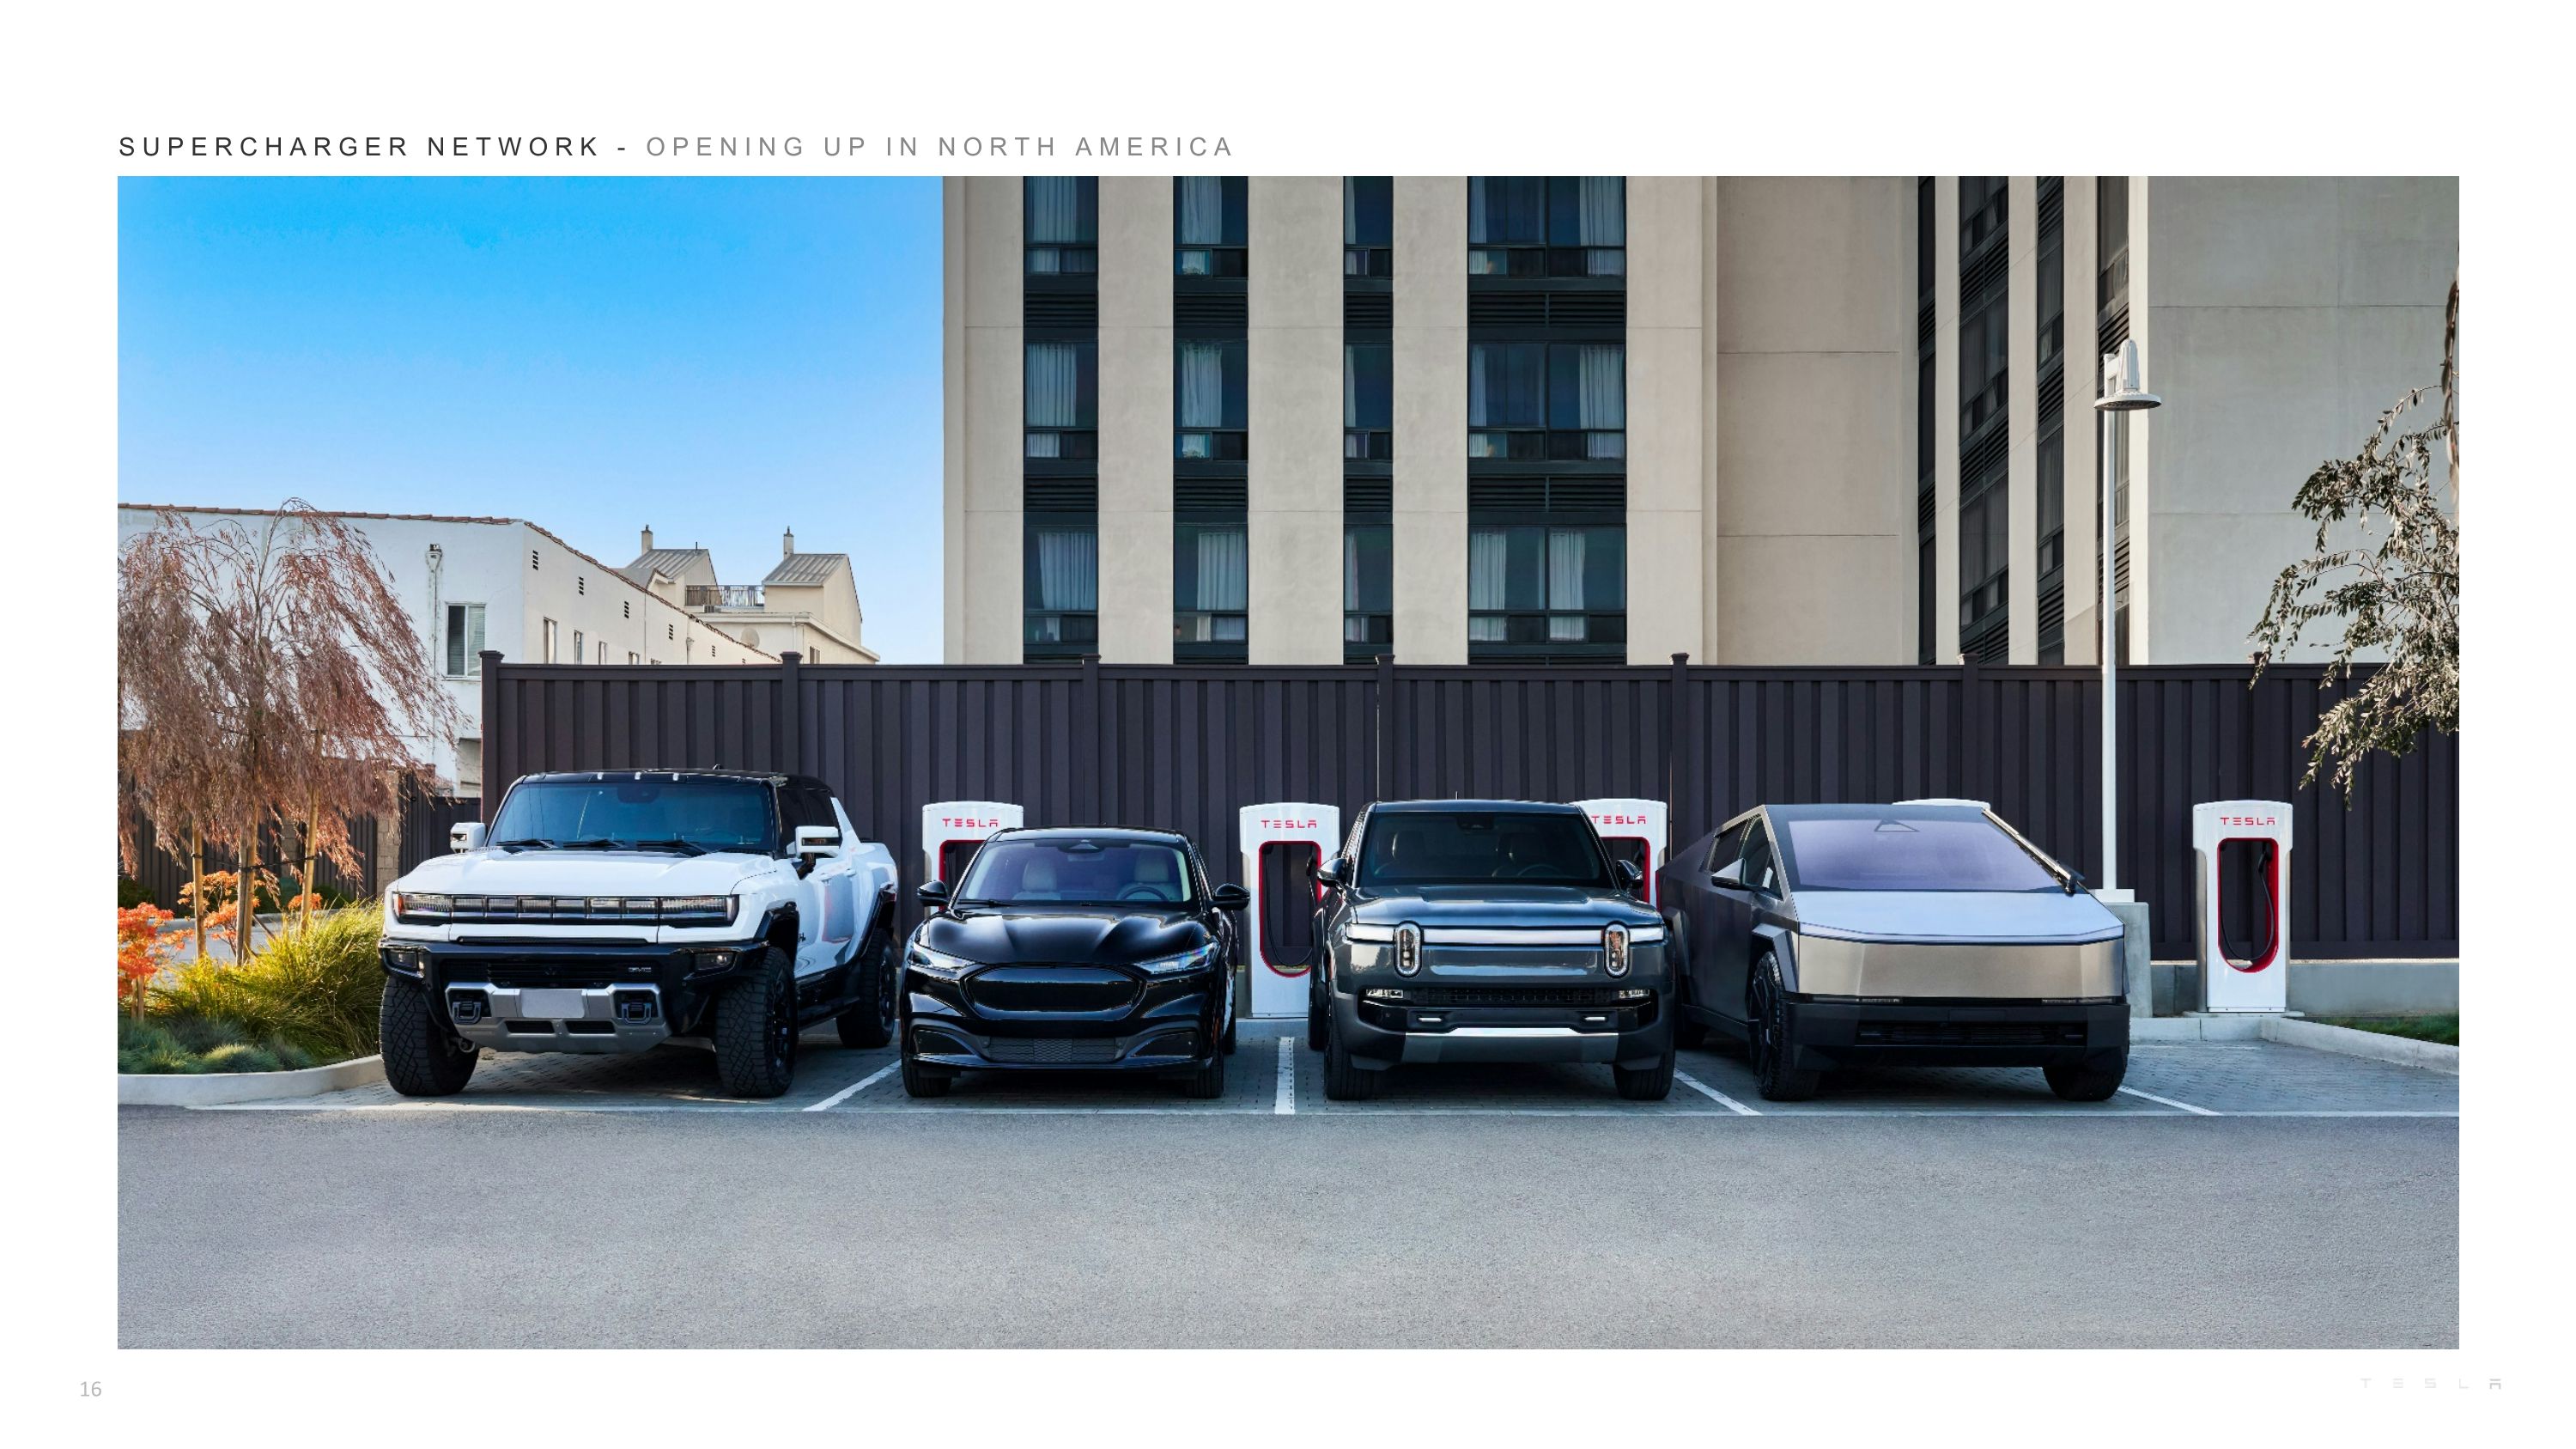
S U P E R C H A R G E R N E T W O R K - O P E N I N G U P I N N O R T H A M E R I C A

P R E V I E W O F R I D E – H A I L I N G I N T H E T E S L A A P P Demonstrative only. Actual look and features subject to change.

D O J O T R A I N I N G C L U S T E R ( N O T A R E N D E R )

M E G A P A C K - P l u s P o w e r ’ s K a p o l e i E n e r g y S t o r a g e F a c I l I t y

T E S L A S E M I - S T A R T O F C O N S T R U C T I O N N E A R G I G A F A C T O R Y N E V A D A

C O S T G R I N D - S Q U E E Z I N G E V E R Y P E N N Y O U T O F T H E v e h I c l e C O S T

Vehicle Deliveries (millions of units) K E Y M E T R I C S Q U A R T E R L Y (Unaudited) Operating Cash Flow ($B) Free Cash Flow ($B) Net Income ($B) Adjusted EBITDA ($B)

Operating Cash Flow ($B) Free Cash Flow ($B) K E Y M E T R I C S T R A I L I N G 1 2 M O N T H S ( T T M ) (Unaudited) Net Income ($B) Adjusted EBITDA ($B) Vehicle Deliveries (millions of units)

F I N A N C I A L S T A T E M E N T S

In millions of USD or shares as applicable, except per share data Q1-2023 Q2-2023 Q3-2023 Q4-2023 Q1-2024 REVENUES Automotive sales 18,878 20,419 18,582 20,630 16,460 Automotive regulatory credits 521 282 554 433 442 Automotive leasing 564 567 489 500 476 Total automotive revenues 19,963 21,268 19,625 21,563 17,378 Energy generation and storage 1,529 1,509 1,559 1,438 1,635 Services and other 1,837 2,150 2,166 2,166 2,288 Total revenues 23,329 24,927 23,350 25,167 21,301 COST OF REVENUES Automotive sales 15,422 16,841 15,656 17,202 13,897 Automotive leasing 333 338 301 296 269 Total automotive cost of revenues 15,755 17,179 15,957 17,498 14,166 Energy generation and storage 1,361 1,231 1,178 1,124 1,232 Services and other 1,702 1,984 2,037 2,107 2,207 Total cost of revenues 18,818 20,394 19,172 20,729 17,605 Gross profit 4,511 4,533 4,178 4,438 3,696 OPERATING EXPENSES Research and development 771 943 1,161 1,094 1,151 Selling, general and administrative 1,076 1,191 1,253 1,280 1,374 Total operating expenses 1,847 2,134 2,414 2,374 2,525 INCOME FROM OPERATIONS 2,664 2,399 1,764 2,064 1,171 Interest income 213 238 282 333 350 Interest expense (29) (28) (38) (61) (76) Other (expense) income, net (48) 328 37 (145) 108 INCOME BEFORE INCOME TAXES 2,800 2,937 2,045 2,191 1,553 Provision for (benefit from) income taxes 261 323 167 (5,752) 409 NET INCOME 2,539 2,614 1,878 7,943 1,144 Net income (loss) attributable to noncontrolling interests and redeemable noncontrolling interests in subsidiaries 26 (89) 25 15 15 NET INCOME ATTRIBUTABLE TO COMMON STOCKHOLDERS 2,513 2,703 1,853 7,928 1,129 Net income per share of common stock attributable to common stockholders Basic $ 0.80 $ 0.85 $ 0.58 $ 2.49 $ 0.37 Diluted $ 0.73 $ 0.78 $ 0.53 $ 2.27 $ 0.34 Weighted average shares used in computing net income per share of common stock Basic 3,166 3,171 3,176 3,181 3,186 Diluted 3,468 3,478 3,493 3,492 3,484 S T A T E M E N T O F O P E R A T I O N S (Unaudited)
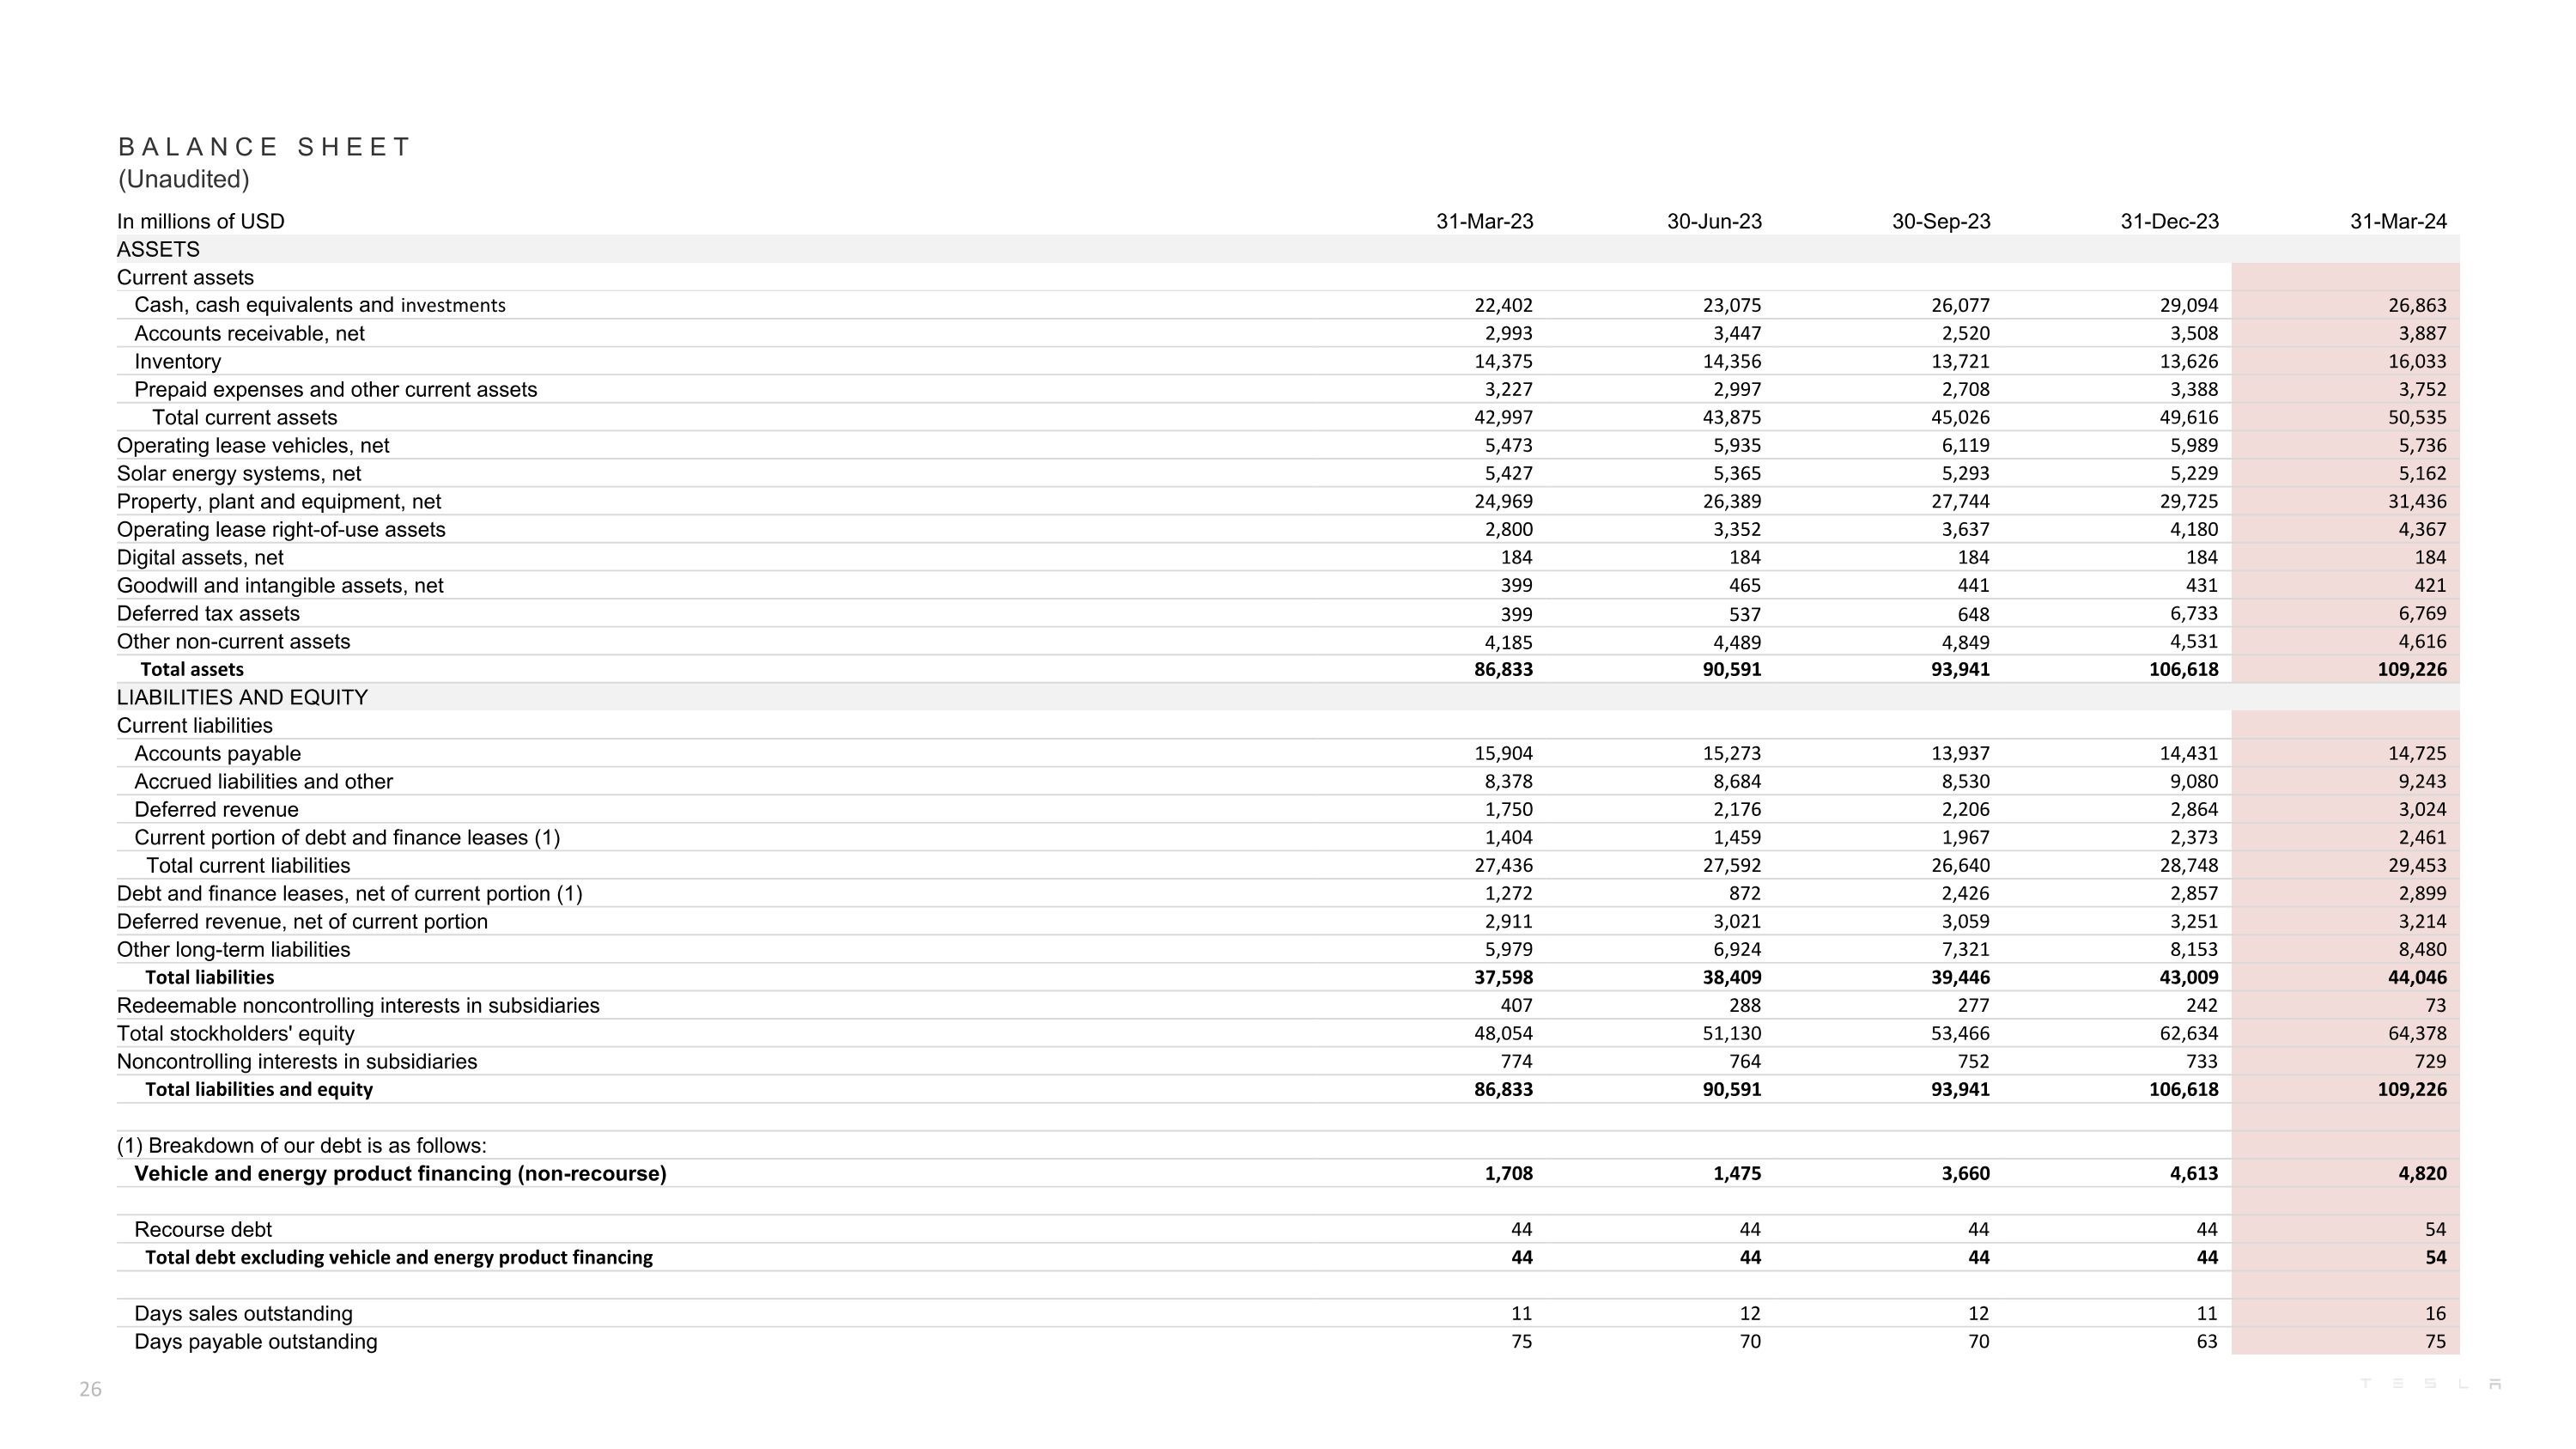
B A L A N C E S H E E T (Unaudited) In millions of USD 31-Mar-23 30-Jun-23 30-Sep-23 31-Dec-23 31-Mar-24 ASSETS Current assets Cash, cash equivalents and investments 22,402 23,075 26,077 29,094 26,863 Accounts receivable, net 2,993 3,447 2,520 3,508 3,887 Inventory 14,375 14,356 13,721 13,626 16,033 Prepaid expenses and other current assets 3,227 2,997 2,708 3,388 3,752 Total current assets 42,997 43,875 45,026 49,616 50,535 Operating lease vehicles, net 5,473 5,935 6,119 5,989 5,736 Solar energy systems, net 5,427 5,365 5,293 5,229 5,162 Property, plant and equipment, net 24,969 26,389 27,744 29,725 31,436 Operating lease right-of-use assets 2,800 3,352 3,637 4,180 4,367 Digital assets, net 184 184 184 184 184 Goodwill and intangible assets, net 399 465 441 431 421 Deferred tax assets 399 537 648 6,733 6,769 Other non-current assets 4,185 4,489 4,849 4,531 4,616 Total assets 86,833 90,591 93,941 106,618 109,226 LIABILITIES AND EQUITY Current liabilities Accounts payable 15,904 15,273 13,937 14,431 14,725 Accrued liabilities and other 8,378 8,684 8,530 9,080 9,243 Deferred revenue 1,750 2,176 2,206 2,864 3,024 Current portion of debt and finance leases (1) 1,404 1,459 1,967 2,373 2,461 Total current liabilities 27,436 27,592 26,640 28,748 29,453 Debt and finance leases, net of current portion (1) 1,272 872 2,426 2,857 2,899 Deferred revenue, net of current portion 2,911 3,021 3,059 3,251 3,214 Other long-term liabilities 5,979 6,924 7,321 8,153 8,480 Total liabilities 37,598 38,409 39,446 43,009 44,046 Redeemable noncontrolling interests in subsidiaries 407 288 277 242 73 Total stockholders' equity 48,054 51,130 53,466 62,634 64,378 Noncontrolling interests in subsidiaries 774 764 752 733 729 Total liabilities and equity 86,833 90,591 93,941 106,618 109,226 (1) Breakdown of our debt is as follows: Vehicle and energy product financing (non-recourse) 1,708 1,475 3,660 4,613 4,820 Recourse debt 44 44 44 44 54 Total debt excluding vehicle and energy product financing 44 44 44 44 54 Days sales outstanding 11 12 12 11 16 Days payable outstanding 75 70 70 63 75

In millions of USD Q1-2023 Q2-2023 Q3-2023 Q4-2023 Q1-2024 CASH FLOWS FROM OPERATING ACTIVITIES Net income 2,539 2,614 1,878 7,943 1,144 Adjustments to reconcile net income to net cash provided by operating activities: Depreciation, amortization and impairment 1,046 1,154 1,235 1,232 1,246 Stock-based compensation 418 445 465 484 524 Deferred income taxes (55) (148) (113) (6,033) (11) Other 40 (47) 145 262 — Changes in operating assets and liabilities (1,475) (953) (302) 482 (2,661) Net cash provided by operating activities 2,513 3,065 3,308 4,370 242 CASH FLOWS FROM INVESTING ACTIVITIES Capital expenditures (2,072) (2,060) (2,460) (2,306) (2,773) Purchases of solar energy systems, net of sales (1) (0) 1 (1) (4) Purchases of investments (2,015) (5,075) (6,131) (5,891) (6,622) Proceeds from maturities of investments 1,604 3,539 3,816 3,394 4,315 Proceeds from sales of investments — 138 — — — Business combinations, net of cash acquired — (76) 12 — — Net cash used in investing activities (2,484) (3,534) (4,762) (4,804) (5,084) CASH FLOWS FROM FINANCING ACTIVITIES Net cash flows from other debt activities (127) (124) (140) (141) (140) Net (repayments) borrowings under vehicle and energy product financing (294) (233) 2,194 952 216 Net cash flows from noncontrolling interests – Solar (43) (34) (45) (76) (131) Other 231 63 254 152 251 Net cash (used in) provided by financing activities (233) (328) 2,263 887 196 Effect of exchange rate changes on cash and cash equivalents and restricted cash 50 (94) (98) 146 (79) Net (decrease) increase in cash and cash equivalents and restricted cash (154) (891) 711 599 (4,725) Cash and cash equivalents and restricted cash at beginning of period 16,924 16,770 15,879 16,590 17,189 Cash and cash equivalents and restricted cash at end of period 16,770 15,879 16,590 17,189 12,464 S T A T E M E N T O F C A S H F L O W S (Unaudited)
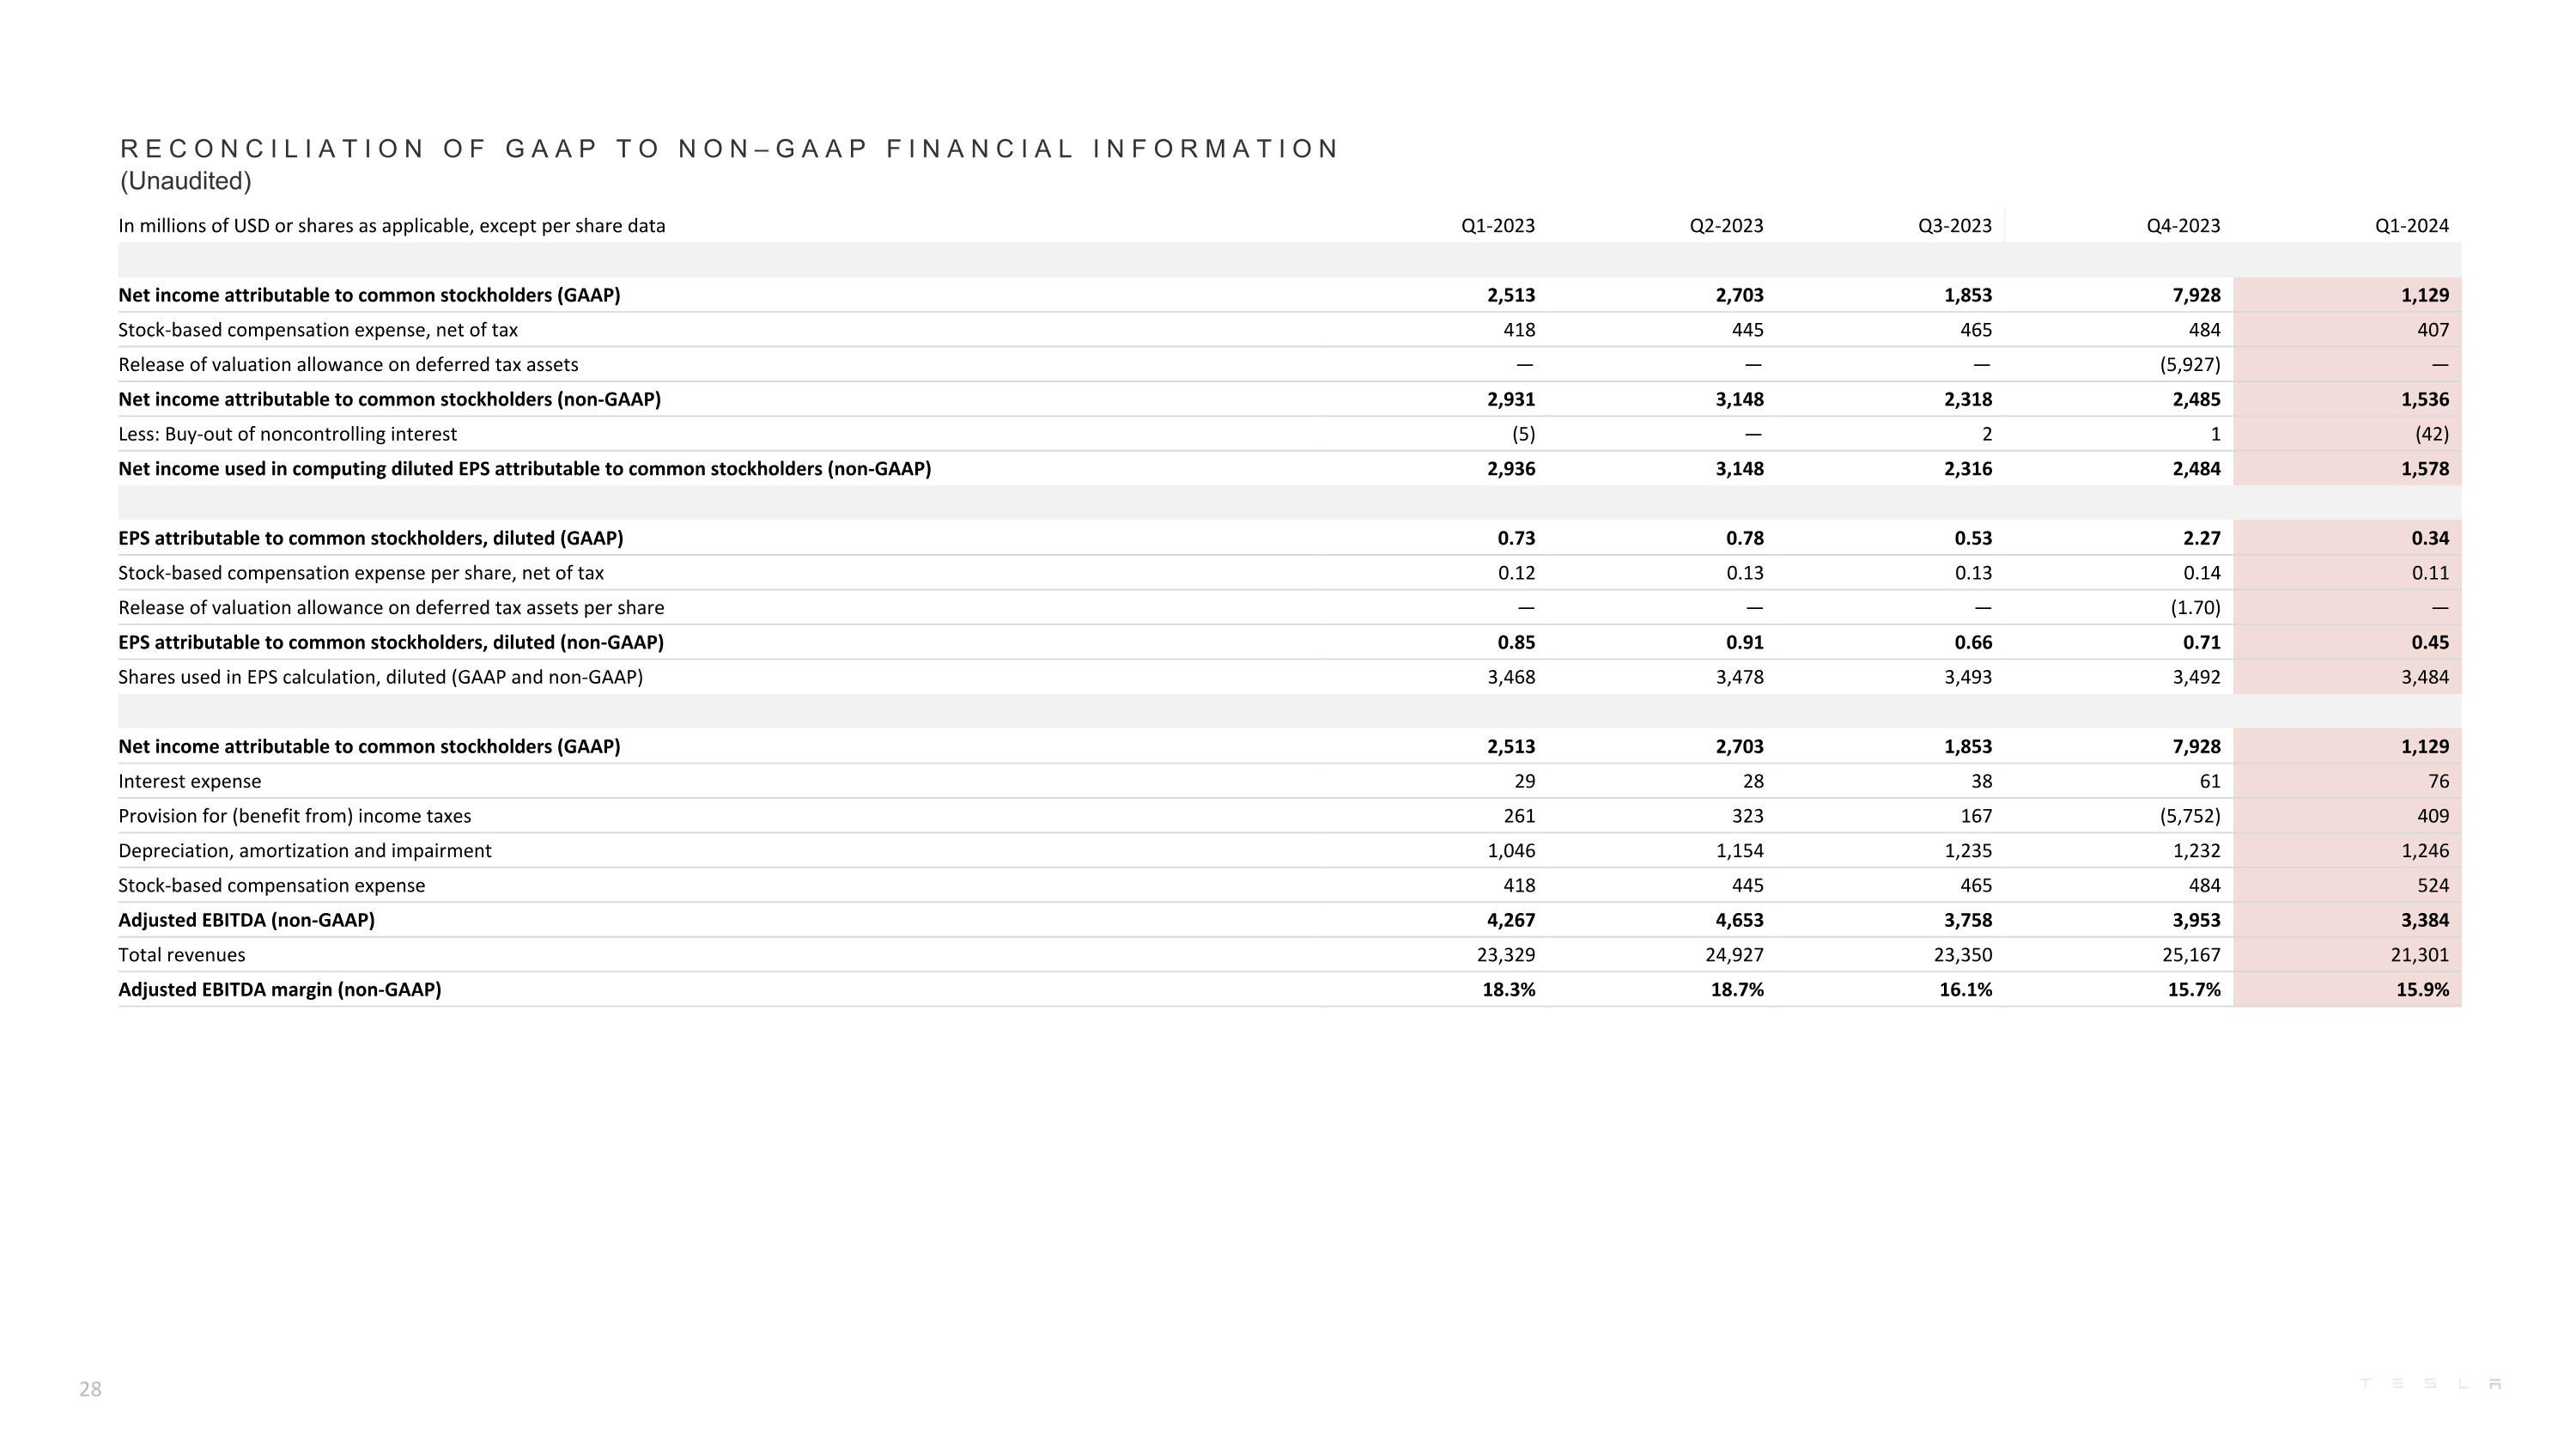
In millions of USD or shares as applicable, except per share data Q1-2023 Q2-2023 Q3-2023 Q4-2023 Q1-2024 Net income attributable to common stockholders (GAAP) 2,513 2,703 1,853 7,928 1,129 Stock-based compensation expense, net of tax 418 445 465 484 407 Release of valuation allowance on deferred tax assets — — — (5,927) — Net income attributable to common stockholders (non-GAAP) 2,931 3,148 2,318 2,485 1,536 Less: Buy-out of noncontrolling interest (5) — 2 1 (42) Net income used in computing diluted EPS attributable to common stockholders (non-GAAP) 2,936 3,148 2,316 2,484 1,578 EPS attributable to common stockholders, diluted (GAAP) 0.73 0.78 0.53 2.27 0.34 Stock-based compensation expense per share, net of tax 0.12 0.13 0.13 0.14 0.11 Release of valuation allowance on deferred tax assets per share — — — (1.70) — EPS attributable to common stockholders, diluted (non-GAAP) 0.85 0.91 0.66 0.71 0.45 Shares used in EPS calculation, diluted (GAAP and non-GAAP) 3,468 3,478 3,493 3,492 3,484 Net income attributable to common stockholders (GAAP) 2,513 2,703 1,853 7,928 1,129 Interest expense 29 28 38 61 76 Provision for (benefit from) income taxes 261 323 167 (5,752) 409 Depreciation, amortization and impairment 1,046 1,154 1,235 1,232 1,246 Stock-based compensation expense 418 445 465 484 524 Adjusted EBITDA (non-GAAP) 4,267 4,653 3,758 3,953 3,384 Total revenues 23,329 24,927 23,350 25,167 21,301 Adjusted EBITDA margin (non-GAAP) 18.3% 18.7% 16.1% 15.7% 15.9% R e c o n c I l I a t I o n o f G A A P t o N o n – G A A P F I n a n c I a l I n f o r m a t I o n (Unaudited)

R e c o n c I l I a t I o n o f G A A P t o N o n – G A A P F I n a n c I a l I n f o r m a t I o n (Unaudited) In millions of USD 2Q-2021 3Q-2021 4Q-2021 1Q-2022 2Q-2022 3Q-2022 4Q-2022 1Q-2023 2Q-2023 3Q-2023 4Q-2023 1Q-2024 Net cash provided by operating activities – TTM (GAAP) 9,184 9,931 11,497 13,851 14,078 16,031 14,724 13,242 13,956 12,164 13,256 10,985 Capital expenditures – TTM (5,009) (5,823) (6,482) (6,901) (7,126) (7,110) (7,158) (7,463) (7,793) (8,450) (8,898) (9,599) Free cash flow – TTM (non-GAAP) 4,175 4,108 5,015 6,950 6,952 8,921 7,566 5,779 6,163 3,714 4,358 1,386 In millions of USD 2Q-2021 3Q-2021 4Q-2021 1Q-2022 2Q-2022 3Q-2022 4Q-2022 1Q-2023 2Q-2023 3Q-2023 4Q-2023 1Q-2024 Net income attributable to common stockholders – TTM (GAAP) 2,181 3,468 5,519 8,399 9,516 11,190 12,556 11,751 12,195 10,756 14,997 13,613 Interest expense – TTM 583 546 371 333 302 229 191 159 143 128 156 203 Provision for (benefit from) income taxes – TTM 453 490 699 976 1,066 1,148 1,132 1,047 1,165 1,027 (5,001) (4,853) Depreciation, amortization and impairment – TTM 2,504 2,681 2,911 3,170 3,411 3,606 3,747 3,913 4,145 4,424 4,667 4,867 Stock-based compensation expense – TTM 2,264 2,196 2,121 1,925 1,812 1,699 1,560 1,560 1,644 1,747 1,812 1,918 Adjusted EBITDA – TTM (non-GAAP) 7,985 9,381 11,621 14,803 16,107 17,872 19,186 18,430 19,292 18,082 16,631 15,748 TTM = Trailing twelve months In millions of USD 3Q-2020 4Q-2020 1Q-2021 2Q-2021 3Q-2021 4Q-2021 1Q-2022 2Q-2022 3Q-2022 4Q-2022 1Q-2023 2Q-2023 3Q-2023 4Q-2023 1Q-2024 Net cash provided by operating activities (GAAP) 2,400 3,019 1,641 2,124 3,147 4,585 3,995 2,351 5,100 3,278 2,513 3,065 3,308 4,370 242 Capital expenditures (1,005) (1,151) (1,348) (1,505) (1,819) (1,810) (1,767) (1,730) (1,803) (1,858) (2,072) (2,060) (2,460) (2,306) (2,773) Free cash flow (non-GAAP) 1,395 1,868 293 619 1,328 2,775 2,228 621 3,297 1,420 441 1,005 848 2,064 (2,531) In millions of USD 3Q-2020 4Q-2020 1Q-2021 2Q-2021 3Q-2021 4Q-2021 1Q-2022 2Q-2022 3Q-2022 4Q-2022 1Q-2023 2Q-2023 3Q-2023 4Q-2023 1Q-2024 Net income attributable to common stockholders (GAAP) 331 270 438 1,142 1,618 2,321 3,318 2,259 3,292 3,687 2,513 2,703 1,853 7,928 1,129 Interest expense 163 246 99 75 126 71 61 44 53 33 29 28 38 61 76 Provision for (benefit from) income taxes 186 83 69 115 223 292 346 205 305 276 261 323 167 (5,752) 409 Depreciation, amortization and impairment 584 618 621 681 761 848 880 922 956 989 1,046 1,154 1,235 1,232 1,246 Stock-based compensation expense 543 633 614 474 475 558 418 361 362 419 418 445 465 484 524 Adjusted EBITDA (non-GAAP) 1,807 1,850 1,841 2,487 3,203 4,090 5,023 3,791 4,968 5,404 4,267 4,653 3,758 3,953 3,384

A D D I T I O N A L I N F O R M A T I O N WEBCAST INFORMATION Tesla will provide a live webcast of its first quarter 2024 financial results conference call beginning at 4:30 p.m. CT on April 23, 2024 at ir.tesla.com. This webcast will also be available for replay for approximately one year thereafter. CERTAIN TERMS When used in this update, certain terms have the following meanings. Our vehicle deliveries include only vehicles that have been transferred to end customers with all paperwork correctly completed. Our energy product deployment volume includes both customer units installed and equipment sales; we report installations at time of commissioning for storage projects or inspection for solar projects, and equipment sales at time of delivery. "Adjusted EBITDA" is equal to (i) net income (loss) attributable to common stockholders before (ii)(a) interest expense, (b) provision for income taxes, (c) depreciation, amortization and impairment and (d) stock-based compensation expense. "Free cash flow" is operating cash flow less capital expenditures. Average cost per vehicle is cost of automotive sales divided by new vehicle deliveries (excluding operating leases). “Days sales outstanding” is equal to (i) average accounts receivable, net for the period divided by (ii) total revenues and multiplied by (iii) the number of days in the period. “Days payable outstanding” is equal to (i) average accounts payable for the period divided by (ii) total cost of revenues and multiplied by (iii) the number of days in the period. “Days of supply” is calculated by dividing new car ending inventory by the relevant quarter’s deliveries and using 75 trading days. Constant currency impacts are calculated by comparing actuals against current results converted into USD using average exchange rates from the prior period. NON-GAAP FINANCIAL INFORMATION Consolidated financial information has been presented in accordance with GAAP as well as on a non-GAAP basis to supplement our consolidated financial results. Our non-GAAP financial measures include non-GAAP net income (loss) attributable to common stockholders, non-GAAP net income (loss) attributable to common stockholders on a diluted per share basis (calculated using weighted average shares for GAAP diluted net income (loss) attributable to common stockholders), Adjusted EBITDA, Adjusted EBITDA margin and free cash flow. These non-GAAP financial measures also facilitate management’s internal comparisons to Tesla’s historical performance as well as comparisons to the operating results of other companies. Management believes that it is useful to supplement its GAAP financial statements with this non-GAAP information because management uses such information internally for its operating, budgeting and financial planning purposes. Management also believes that presentation of the non-GAAP financial measures provides useful information to our investors regarding our financial condition and results of operations, so that investors can see through the eyes of Tesla management regarding important financial metrics that Tesla uses to run the business and allowing investors to better understand Tesla’s performance. Non-GAAP information is not prepared under a comprehensive set of accounting rules and therefore, should only be read in conjunction with financial information reported under U.S. GAAP when understanding Tesla’s operating performance. A reconciliation between GAAP and non-GAAP financial information is provided above. FORWARD-LOOKING STATEMENTS Certain statements in this update, including statements in the “Outlook” section; statements relating to the future development, strategy, ramp, production and capacity, demand and market growth, cost, pricing and profitability, investment, deliveries, deployment, availability and other features and improvements and timing of existing and future Tesla products; statements regarding operating margin, operating profits, spending and liquidity; and statements regarding expansion, improvements and/or ramp and related timing at our factories are “forward-looking statements” that are subject to risks and uncertainties. These forward-looking statements are based on management’s current expectations, and as a result of certain risks and uncertainties, actual results may differ materially from those projected. The following important factors, without limitation, could cause actual results to differ materially from those in the forward-looking statements: the risk of delays in launching and manufacturing our products and features cost-effectively; our ability to grow our sales, delivery, installation, servicing and charging capabilities and effectively manage this growth; consumers’ demand for electric vehicles generally and our vehicles specifically; the ability of suppliers to deliver components according to schedules, prices, quality and volumes acceptable to us, and our ability to manage such components effectively; any issues with lithium-ion cells or other components manufactured at our factories; our ability to ramp our factories in accordance with our plans; our ability to procure supply of battery cells, including through our own manufacturing; risks relating to international expansion; any failures by Tesla products to perform as expected or if product recalls occur; the risk of product liability claims; competition in the automotive and energy product markets; our ability to maintain public credibility and confidence in our long-term business prospects; our ability to manage risks relating to our various product financing programs; the status of government and economic incentives for electric vehicles and energy products; our ability to attract, hire and retain key employees and qualified personnel; our ability to maintain the security of our information and production and product systems; our compliance with various regulations and laws applicable to our operations and products, which may evolve from time to time; risks relating to our indebtedness and financing strategies; and adverse foreign exchange movements. More information on potential factors that could affect our financial results is included from time to time in our Securities and Exchange Commission filings and reports, including the risks identified under the section captioned “Risk Factors” in our annual report on Form 10-K filed with the SEC on January 26, 2024. Tesla disclaims any obligation to update information contained in these forward-looking statements whether as a result of new information, future events or otherwise.


