FY25 Investor Metrics August 2024 Exhibit 99.1

This presentation contains forward-looking statements, which are any predictions, projections, or other statements about future events. These statements are based on current expectations and assumptions that are subject to risks and uncertainties. Actual results could materially differ because of factors discussed in the Risk Factors section and other sections of our Form 10-K, Forms 10-Q, and other reports and filings with the Securities and Exchange Commission. We do not undertake any duty to update forward-looking statements.

Agenda Disclosure framework Updates for FY25 Segment changes Metric changes FY25 Q1 Outlook updates

SEC filings (10-Qs and 10-K) Business highlights and comparative view of performance (GAAP and constant currency) Enable investors to evaluate progress against our ambitions Provide transparency into performance trends Reflect the continued evolution of our products and services Momentum and innovation from a product, customer, and partner perspective To enhance investor understanding of our business, Microsoft regularly discloses supplemental financial information, business highlights, and key performance indicators Earnings press release and slides Earnings commentary Investor metrics Disclosure framework

FY24 Segment structure FY25 Segment structure Productivity and Business Processes Productivity and Business Processes Office products and cloud services Office Commercial products and cloud services Microsoft 365 Commercial products and cloud services Microsoft 365 Commercial cloud Microsoft 365 Commercial products Office Consumer products and cloud services Microsoft 365 Consumer products and cloud services Microsoft 365 Consumer cloud Office Consumer products Dynamics products and cloud services Dynamics 365 Dynamics products and cloud services Dynamics 365 Dynamics products Dynamics products LinkedIn LinkedIn Intelligent Cloud Intelligent Cloud Server products and cloud services Azure and other cloud services Server products and cloud services Azure and other cloud services Server products Server products Enterprise and partner services Enterprise and partner services More Personal Computing More Personal Computing Windows Windows OEM Windows and Devices Windows OEM and Devices Windows Commercial products and cloud services Windows other Windows other Devices Search and news advertising Search and news advertising Gaming Xbox content and services Gaming Xbox content and services Xbox hardware Xbox hardware Updates for FY25 – Segment structure

Key segment change – Microsoft 365 Commercial We have brought revenue from the commercial components of Microsoft 365 together in the Productivity and Business Processes (“PBP”) segment to align to how the business is managed. “Microsoft 365 Commercial products and cloud services” will now be reported in SEC filings and our KPIs have been adjusted as well. Microsoft 365 Commercial products and cloud services now includes: Office Commercial products and cloud services revenue, already in the PBP segment Enterprise Mobility + Security (“EMS”) and Power BI per-user revenue, previously reported in Azure within the Intelligent Cloud (“IC”) segment Windows Commercial products and cloud services revenue, previously reported in Windows within the More Personal Computing (“MPC”) segment The cloud portion of Microsoft 365 Commercial will be reported as "Microsoft 365 Commercial cloud" and the on-premises portion will be reported as "Microsoft 365 Commercial products" Other segment changes Copilot Pro revenue has moved from Office Consumer products and cloud services in our PBP segment to Search and news advertising in our MPC segment to align to how the business is managed. We then renamed “Office Consumer products and cloud services” to “Microsoft 365 Consumer products and cloud services” given the current branding of the product. Nuance Enterprise revenue has moved from Server products and cloud services in the IC segment to Dynamics products and cloud services in the PBP segment. Nuance Healthcare revenue remains in Server products and cloud services. These changes better align to how the businesses are managed. Windows revenue (now excluding Windows Commercial revenue as noted above) and Devices revenue will now be reported together in SEC filings to bring revenue from PC market-driven businesses together Revenue moved from Search and news advertising in the MPC segment to Azure in the IC segment, and therefore will be included in Microsoft Cloud metrics, to better align with similar commercial services Updates for FY25 – Segment changes

Metric changes

FY25 Investor metrics Commercial metrics Commercial bookings growth Commercial remaining performance obligation Commercial revenue annuity mix Microsoft Cloud revenue and revenue growth Microsoft Cloud gross margin percentage Microsoft 365 Commercial cloud revenue growth Microsoft 365 Commercial seat growth Microsoft 365 Consumer cloud revenue growth Microsoft 365 Consumer subscribers Productivity & Business Processes; Intelligent Cloud Dynamics 365 revenue growth LinkedIn revenue growth Azure and other cloud services revenue growth Windows OEM and Devices revenue growth Xbox content and services revenue growth More Personal Computing Search and news advertising revenue (ex TAC) growth

What changes and why? As a result of the Microsoft 365 Commercial segment change, “Microsoft 365 Commercial cloud revenue growth” metric created in the PBP segment to align to how the business is managed. The metric is comprised of: Office 365 Commercial revenue EMS revenue and Power BI per-user revenue, previously in the Azure metric within the IC segment Cloud portion of Windows Commercial revenue, previously in the Windows Commercial metric within the MPC segment With EMS revenue and Power BI per-user revenue moved into Microsoft 365 Commercial cloud metric, Azure metric now more closely aligns to consumption business “Office 365 Commercial seat growth” renamed to “Microsoft 365 Commercial seat growth” to align with product branding What does not change? Definition and calculation previously used for Office 365 Commercial seat growth remains unchanged for Microsoft 365 Commercial seat growth Microsoft 365 Commercial cloud metric

Microsoft 365 Commercial cloud metric change FY24 Segment structure Productivity and Business Processes Office products and cloud services Office Commercial products and cloud services Office 365 Commercial Office Commercial products Office Consumer products and cloud services Dynamics products and cloud services Dynamics 365 Dynamics products LinkedIn Intelligent Cloud Server products and cloud services Azure and other cloud services Azure consumption EMS & Power BI per-user Other cloud services Server products Enterprise and partner services More Personal Computing Windows Windows OEM Windows Commercial products and cloud services Windows Commercial cloud Windows Commercial products Windows other Devices Search and news advertising Gaming Xbox content and services Xbox hardware FY25 Segment structure Productivity and Business Processes Microsoft 365 Commercial products and cloud services Microsoft 365 Commercial cloud Office 365 Commercial EMS & Power BI per-user Windows Commercial cloud Microsoft 365 Commercial products Office Commercial products Windows Commercial products Microsoft 365 Consumer products and cloud services Microsoft 365 Consumer cloud Office Consumer products Dynamics products and cloud services Dynamics 365 Dynamics products LinkedIn Intelligent Cloud Server products and cloud services Azure and other cloud services Azure consumption Other cloud services Server products Enterprise and partner services More Personal Computing Windows and Devices Windows OEM and Devices Windows other Search and news advertising Gaming Xbox content and services Xbox hardware

What changes and why? Copilot Pro subscribers removed from Microsoft 365 Consumer subscribers metric to align with the corresponding Copilot Pro revenue movement out of Microsoft 365 Consumer Windows OEM revenue growth and Devices revenue growth metrics replaced by “Windows OEM and Devices revenue growth” metric to align to how the PC market-driven businesses are managed We elevated our cloud revenue growth metrics for Microsoft 365 Commercial, Microsoft 365 Consumer, Dynamics 365, and Azure to be KPIs, which have replaced the former “products and cloud services” KPIs. This elevation aligns to our strategic focus on cloud growth. Changes are as follows: Other metric changes FY24 Metrics FY25 Metrics Office Commercial products and cloud services revenue growth Microsoft 365 Commercial cloud revenue growth Office Consumer products and cloud services revenue growth Microsoft 365 Consumer cloud revenue growth Dynamics products and cloud services revenue growth Dynamics 365 revenue growth Server products and cloud services revenue growth Azure and other cloud services revenue growth

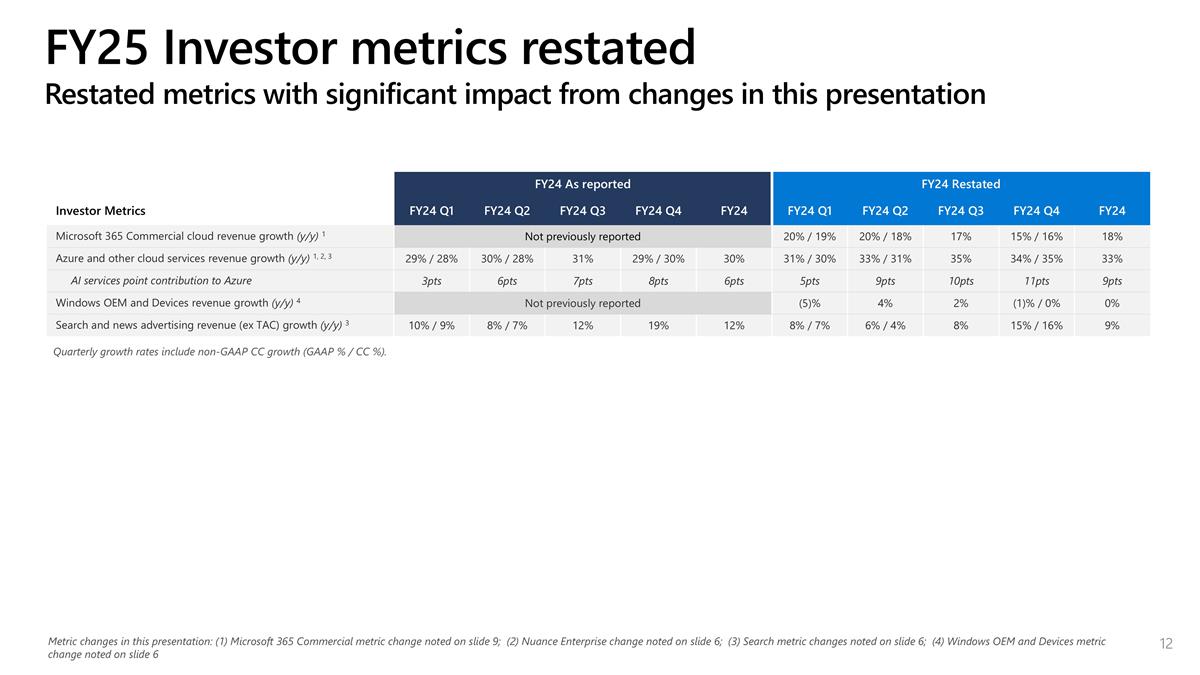
FY24 As reported FY24 Restated Investor Metrics FY24 Q1 FY24 Q2 FY24 Q3 FY24 Q4 FY24 FY24 Q1 FY24 Q2 FY24 Q3 FY24 Q4 FY24 Microsoft 365 Commercial cloud revenue growth (y/y) 1 Not previously reported 20% / 19% 20% / 18% 17% 15% / 16% 18% Azure and other cloud services revenue growth (y/y) 1, 2, 3 29% / 28% 30% / 28% 31% 29% / 30% 30% 31% / 30% 33% / 31% 35% 34% / 35% 33% AI services point contribution to Azure 3pts 6pts 7pts 8pts 6pts 5pts 9pts 10pts 11pts 9pts Windows OEM and Devices revenue growth (y/y) 4 Not previously reported (5)% 4% 2% (1)% / 0% 0% Search and news advertising revenue (ex TAC) growth (y/y) 3 10% / 9% 8% / 7% 12% 19% 12% 8% / 7% 6% / 4% 8% 15% / 16% 9% Quarterly growth rates include non-GAAP CC growth (GAAP % / CC %). FY25 Investor metrics restated Restated metrics with significant impact from changes in this presentation Metric changes in this presentation: (1) Microsoft 365 Commercial metric change noted on slide 9; (2) Nuance Enterprise change noted on slide 6; (3) Search metric changes noted on slide 6; (4) Windows OEM and Devices metric change noted on slide 6

FY25 Q1 Outlook updates

As provided on July 30, 2024 Updated outlook Foreign currency impact Decrease to revenue growth at the total company and all individual segment levels of less than 1 point Decrease to COGS growth of less than 1 point and no meaningful impact to Opex growth No change Productivity and Business Processes Revenue of $20.3 to $20.6 billion Revenue of $27.75 to $28.05 billion Intelligent Cloud Revenue of $28.6 to $28.9 billion Revenue of $23.80 to $24.10 billion More Personal Computing Revenue of $14.9 to $15.3 billion Revenue of $12.25 to $12.65 billion Cost of revenue COGS of $19.95 to $20.15 billion including approximately $0.7 billion of purchase accounting adjustments, as well as integration and transaction-related costs from the Activision acquisition No change Operating expenses Expenses of $15.2 to $15.3 billion including approximately $0.2 billion of purchase accounting adjustments, as well as integration and transaction-related costs from the Activision acquisition No change Other income and expense Expected to be roughly $(650) million No change Effective tax rate Approximately 19% No change FY25 Q1 Outlook updated We will report our FY25 Q1 results in the structure discussed on the prior slides. Therefore, we have provided mechanical updates only to our outlook as provided on July 30, 2024 for the changes discussed in this presentation.

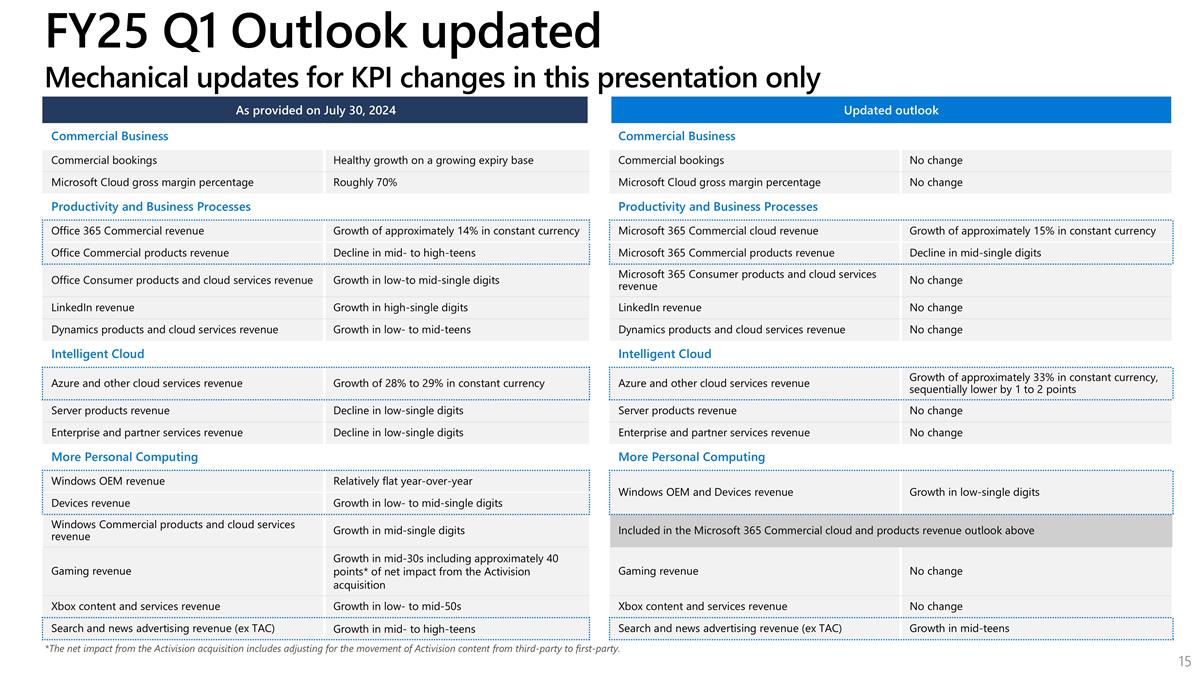
As provided on July 30, 2024 Updated outlook Commercial Business Commercial Business Commercial bookings Healthy growth on a growing expiry base Commercial bookings No change Microsoft Cloud gross margin percentage Roughly 70% Microsoft Cloud gross margin percentage No change Productivity and Business Processes Productivity and Business Processes Office 365 Commercial revenue Growth of approximately 14% in constant currency Microsoft 365 Commercial cloud revenue Growth of approximately 15% in constant currency Office Commercial products revenue Decline in mid- to high-teens Microsoft 365 Commercial products revenue Decline in mid-single digits Office Consumer products and cloud services revenue Growth in low-to mid-single digits Microsoft 365 Consumer products and cloud services revenue No change LinkedIn revenue Growth in high-single digits LinkedIn revenue No change Dynamics products and cloud services revenue Growth in low- to mid-teens Dynamics products and cloud services revenue No change Intelligent Cloud Intelligent Cloud Azure and other cloud services revenue Growth of 28% to 29% in constant currency Azure and other cloud services revenue Growth of approximately 33% in constant currency, sequentially lower by 1 to 2 points Server products revenue Decline in low-single digits Server products revenue No change Enterprise and partner services revenue Decline in low-single digits Enterprise and partner services revenue No change More Personal Computing More Personal Computing Windows OEM revenue Relatively flat year-over-year Windows OEM and Devices revenue Growth in low-single digits Devices revenue Growth in low- to mid-single digits Windows Commercial products and cloud services revenue Growth in mid-single digits Included in the Microsoft 365 Commercial cloud and products revenue outlook above Gaming revenue Growth in mid-30s including approximately 40 points* of net impact from the Activision acquisition Gaming revenue No change Xbox content and services revenue Growth in low- to mid-50s Xbox content and services revenue No change Search and news advertising revenue (ex TAC) Growth in mid- to high-teens Search and news advertising revenue (ex TAC) Growth in mid-teens *The net impact from the Activision acquisition includes adjusting for the movement of Activision content from third-party to first-party. FY25 Q1 Outlook updated Mechanical updates for KPI changes in this presentation only

Appendix

FY25 Investor metric definitions Commercial metrics Commercial bookings growth: for commercial products and cloud services, sum of revenue growth, plus change in balance of unearned revenue plus the change in contracted not billed balance Commercial remaining performance obligation: commercial portion of revenue allocated to remaining performance obligations, which includes unearned revenue and amounts that will be invoiced and recognized as revenue in future periods Commercial revenue annuity mix: percentage of sales where revenue is recognized over more than one period Microsoft Cloud revenue and revenue growth: revenue from Microsoft 365 Commercial cloud, Azure and other cloud services, the commercial portion of LinkedIn, Dynamics 365, and other commercial cloud properties Microsoft Cloud gross margin percentage: gross margin percentage for our Microsoft Cloud business

Microsoft 365 Commercial cloud revenue growth: revenue from Microsoft 365 Commercial subscriptions, comprising Microsoft 365 Commercial, Exchange, SharePoint, Microsoft Teams, Microsoft 365 Security and Compliance, Enterprise Mobility + Security, the cloud portion of Windows Commercial, the per-user portion of Power BI, Microsoft Viva, and Copilot for Microsoft 365 Microsoft 365 Commercial seat growth: the number of Microsoft 365 Commercial seats at end of period where seats are paid users covered by a Microsoft 365 Commercial subscription Microsoft 365 Consumer cloud revenue growth: revenue from Microsoft 365 Consumer subscriptions and other consumer services Microsoft 365 Consumer subscribers: the number of Microsoft 365 Consumer subscribers at end of period Dynamics 365 revenue growth: revenue from Dynamics 365, including a set of intelligent, cloud-based applications across ERP, CRM, Power Apps, and Power Automate LinkedIn revenue growth: revenue from LinkedIn, including Talent Solutions, Marketing Solutions, Premium Subscriptions, and Sales Solutions Azure and other cloud services revenue growth: revenue from Azure and other cloud services, including cloud and AI consumption-based services, GitHub cloud services, Nuance Healthcare cloud services, virtual desktop offerings, and other cloud services FY25 Investor metric definitions Productivity & Business Processes; Intelligent Cloud

Windows OEM & Devices revenue growth: revenue from sales of Windows Pro and non-Pro licenses sold through the OEM channel and sales of first-party Devices, including Surface, HoloLens, and PC accessories Xbox content and services revenue growth: revenue from Xbox content and services, comprising first- and third-party content (including games and in-game content), Xbox Game Pass and other subscriptions, Xbox Cloud Gaming, advertising, third-party disc royalties, and other cloud services Search and news advertising revenue (ex TAC) growth: revenue from search and news advertising excluding traffic acquisition costs ("TAC") paid to Bing Ads network publishers and news partners FY25 Investor metric definitions More Personal Computing


