- PKX Dashboard
- Financials
- Filings
-
Holdings
- Transcripts
- ETFs
-
Insider
- Institutional
- Shorts
-
6-K Filing
POSCO (PKX) 6-KCurrent report (foreign)
Filed: 23 Dec 24, 9:45am
Exhibit 99.1
-
HOLDINGS POSCO Holdings Corporate Value-up Plan Dec. 2024 *
• . * * ’ posco HOLDINGS Disclaimer This presentation contains certain forward-looking statements relating to future financial condition and business performance of the company and/or the industry in which it operates. The forward-looking statements set forth herein concern future circumstances that are not historical facts and are based on views and forecasts which are uncertain and subject to risk. Therefore, readers of this presentation shall be aware that forward-looking statements set forth herein may not correspond to the company’s actual business performance, resulting from changes and risks in business environment and conditions. The Company assumes no duty nor undertakes any obligation, to revise or update any forward-looking statements to reflect changes that arise from causes that impact the forecast information. This presentation has been prepared to serve informational purposes; therefore, this document should not be construed as an offer to purchase, subscribe to, or trade securities and/or to solicit subscription. The Company does not offer guarantee, expressed or implied, as to the accuracy and/or completeness of this presentation or of the information contained herein and does not assume any liability for the information described in this presentation.

CHAPTER CHAPTER CHAPTER CHAPTER I i in w I Overview Value-up Plan Governance Communication POSCO HOLDINGS CORPORATE VALUE-UP PLAN
Overview Vision Company Profile Core Business . History POSCO HOLIDNGS CORPORATE VALUE-UP

- posco vision HOLDINGS Materials for Tomorrow, Innovation for Excellence Secondary Battery j Materials Energy/ New Infrastructure J Business Flagship business Growth Engine Working as a key generator, Building production and propelled by unrivaled R&D competitiveness industry leadership Robust factor Opportunity in global market Adding up stable growth Looking into promising materials and softening earnings from aligned with group’s strategy cyclical steel business
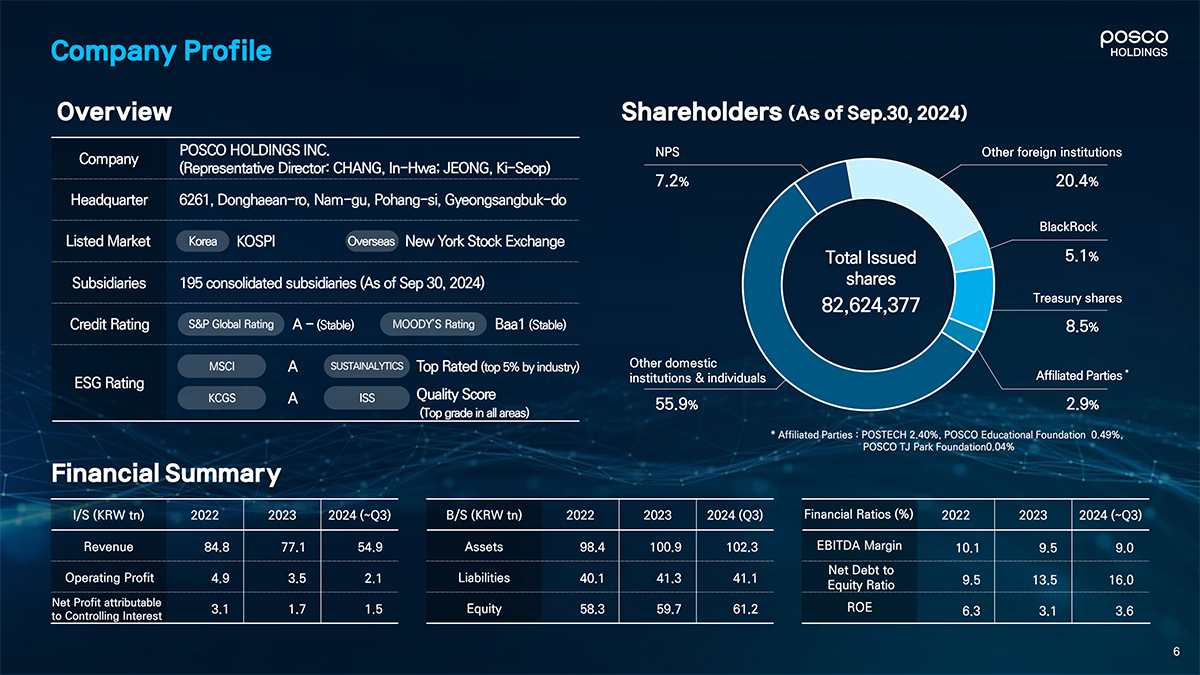
Company Profile Foldings Overview Shareholders (As of sep.30,2024) Cnmrwinv POSCO HOLDINGS INC. NPS Other foreign institutions y (Representative Director CHANG, In-Hwa; JEONG, Ki-Seop) Headquarter 6261, Donghaean-ro, Nam-gu, Pohang-si, Gyeongsangbuk-do BlackRock Listed Market Korea KOSPI Overseas New York Stock Exchange Total Issued 5.1% Subsidiaries 195 consolidated subsidiaries (As of Sep 30,2024) shares 1 82,624,377 Treasury shares Credit Rating S&p Global Rating A—(Stable) MOODY’S Rating Baal (Stable) 8.5% MSC! A sustainalytics Top Rated (top 5% by industry) * ESG Rating institutions & individuals Affiliated Parties (Top grade in all areas) 55.9% 2.9% * Affiliated Parties : POSTECH 2.40%, POSCO Educational Foundation 0.49%, POSCO TJ Park Foundation0.04% Financial Summary l/S (KRW tn) 2022 2023 2024 (~Q3) B/S (KRW tn) 2022 2023 2024 (Q3) Financial Ratios (%) 2022 2023 2024 (~Q3) Revenue 84.8 77.1 54,9 Assets 98.4 100,9 102.3 EBITDA Margin 10.1 9.5 9.0 Operating Profit 4.9 3.5 2.1 Liabilities 40.1 41.3 41.1 Equi^Ratio 9 5 13 5 16 0 Net Profit attributable 3 J 17 15 Equity 58.3 59 7 61 2 R0E to Controlling Interest

OOSCO Core Business ^holdings I Pursue sustainable growth by cultivating new growth businesses such as secondary battery materials based on stable profit generation from steel and infrastructure businesses • POSCO and new secondary battery materials entities will remain unlisted to ensure the whole investment is well linked with POSCO Holdings shareholders’ value posco HOLDINGS • • • Steel (84 companies) Secondary Battery Materials (17 companies) Infrastructure Business (80 companies) I I OOSCO posco Pilbara pOSOO POSCO I IQgy “ FUTUREM LITHIUM SOLUTION GS Eco Materials INTERNATIONAL E&C ‘ DX II Affiliated 100% 60% 82% 51% 71% 53% 53% | Companies krakatau poeco Other pOSOO POSCO Ultium CAM pOSCO overseas STEELEON M-TECH Argentina Silicon Solution HYCLEAN METAL MOBIUTY SOLUTION I 50% subsidiaries 57% 49% 85% 100% 100% 65% 100% I Listed Non-listed Asset Revenue Asset Revenue Asset Revenue Key Index 5 i 129% 46% pOSCO POSCO posco Business STEELEON M-TECH FUTURE M ARGENTINA lit™solution hycleanmetal international esc dx The world’s most Steel packaging, Sole domestic supplier Areas competitive Coated steel, Supplementary of both anode and Lithium hydroxide Lithium ,Nickel, Trading, Natural gas, Plant, Infrastructure, Factory automation, steelmaker (WSD) Color steel materials for Iron Ore cathode materials production Cobalt extraction Power generation Construction IT logistics service

History Global expansion & Evolving into Foundation Growth into a steelmaking legend Privatization business diversification a top-tier matenals company 1967-1973 1974-1992 1993-2002 2003-2018 2019-Present 1968.4. 1974.12. 1994.10. 2003.11. 2019.4. Pohang Iron &Steel Company is $100M achieved in steel exports; W100B Listed on the New York Stock POSCO-China is launched CAM and AAM businesses are consolidated established recorded in corporate revenues Exchange for the first time in Korea 1968.5. 1987.5. ( 2005.9. 2022.1. Pohang Steel Mill Phase 1 begins Gwangyang Steel Mill Phase 1(11.8 M tons) POSCO Energy is launched New Experience of Technology Hub construction completes construction (N.E.X.T. Hub) is established 1973.6. 1988.6. 2000.10. 201 2022.3. Initial batch of molten iron tapped Listed on the Korea Stock Exchange Completed privatization POSCO DX is launched / POSCO POSCO Holdings is launched at Pohang Blast Furnace No. 1 (People’s Stock No.1) “enters the AAMbuslne^/—POSCO Group acquires Daewoo Int I 1992.16;2662.3.2013’12’ Celebrated construction milestones reached Rebranded as POSCO Construction of Krakatau POSCO is over the past quarter~century(2l million tons) completed in Indonesia 1972 1975 1978 1981 1984 1987 1990 1993 1996 1999 2002 2005 2008 2011 2014 2017 2020 2023

Value-upPlan Analysis Revenue growth/ ROIC / Shareholder return POSCO HOLIDNGS CORPORATE VALUE-UP PLAN
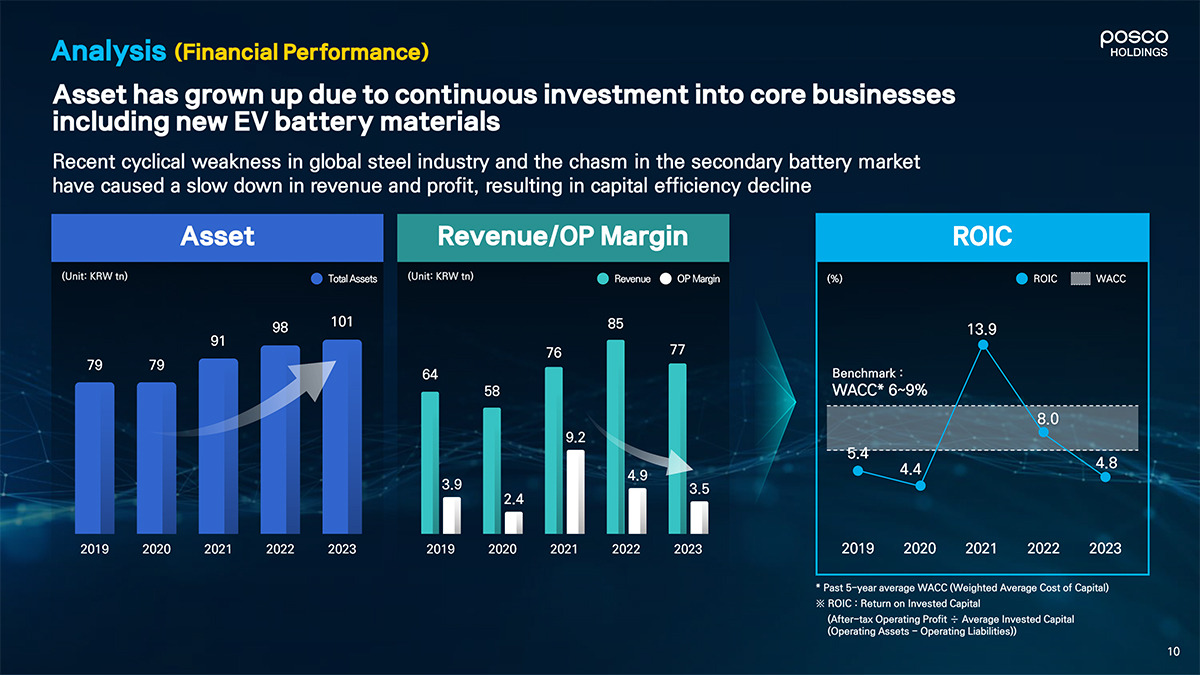
posco Analysis (Financial Performance) holdings Asset has grown up due to continuous investment into core businesses including new EV battery materials Recent cyclical weakness in global steel industry and the chasm in the secondary battery market have caused a slow down in revenue and profit, resulting in capital efficiency decline Asset Revenue/OP Margin ROIC (Unit KRW tn) Total Assets (UnitKRWtn) Revenue OP Magin (%) ROIC WACC 98 101 85 13 9 79 79 76 Benchmark: 2019 2020 2021 2022 2023 2019 2020 2021 2022 2023 2019 2020 2021 2022 2023 * Past 5-year average WACC (Weighted Average Cost of Capital) ^ ROIC : Return on Invested Capital (After-tax Operating Profit 4- Average Invested Capital (Operating Assets—Operating Liabilities))
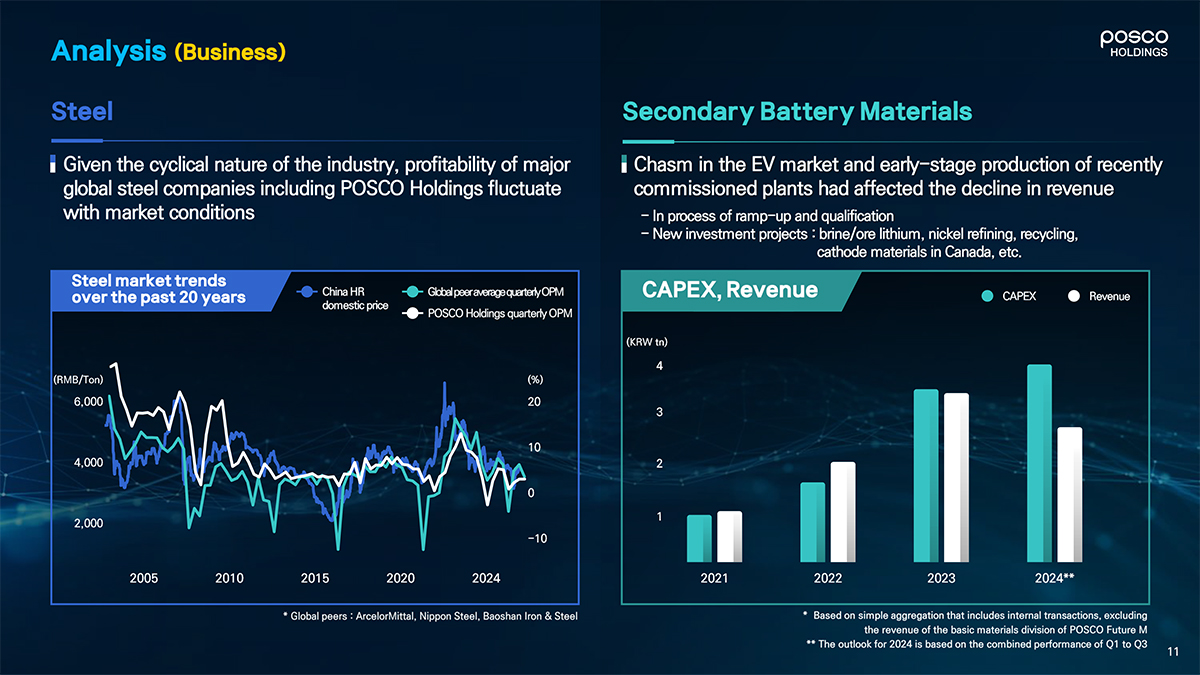
Steel Secondary Battery Materials i Given the cyclical nature of the industry, profitability of major I Chasm in the EV market and early-stage production of recently global steel companies including POSCO Holdings fluctuate commissioned plants had affected the decline in revenue with market conditions—In process of ramp-up and qualification—New investment projects: brine/one lithium, nickel refining, recycling, cathode materials in Canada, etc. Steel market trends over the past 20 years 7 Global peer average qiertery OPM A, ReVenUe CAPEX Revenue domestic price POSCO Holdings quarterly 0PM (KRW tn) (RMB/Ton) (%) 2005 2010 2015 2020 2024 2021 2022 2023 2024** 1 Global peers : ArcelorMittal, Nippon Steel, Baoshan Iron & Steel * Based on simple aggregation that includes internal transactions, excluding the revenue of the basic materials division of POSCO Future M 2 * The outlook for 2024 is based on the combined performance of Q1 to Q3
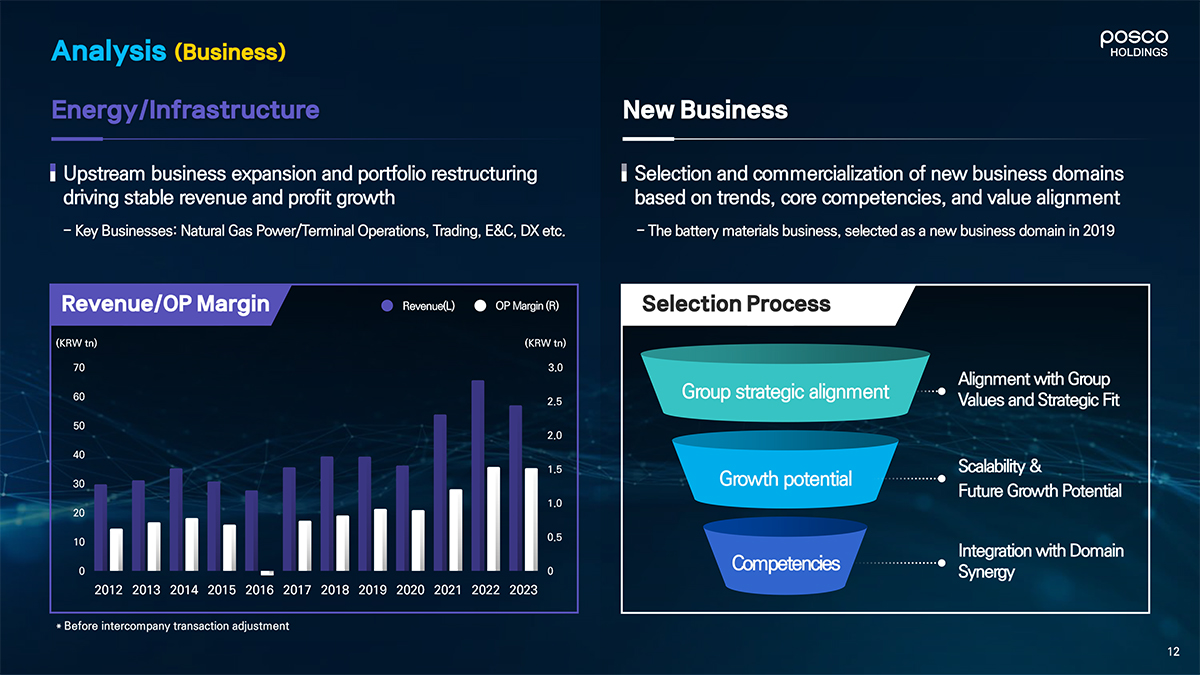
posco Analysis (Business) HOLDINGS Energy/lnf rastructure New Business Upstream business expansion and portfolio restructuring Selection and commercialization of new business domains driving stable revenue and profit growth based on trends, core competencies, and value alignment—Key Businesses: Natural Gas Power/Terminal Operations, Trading, E&C, DX etc.—The battery materials business, selected as a new business domain in 2019 Revenue/OP Margin Revenue(L) OP Margin (R) (KRW tn) (KRW tn) 70 3.0 Alignment with Group Group strategic alignment values and Strategic Rt 50 2.0 30 Growth potential Future Growth Potential 10 Integration with Domain Competencies synergy 2012 2013 2014 2015 2016 2017 2018 2019 2020 2021 2022 2023 * Before intercompany transaction adjustment
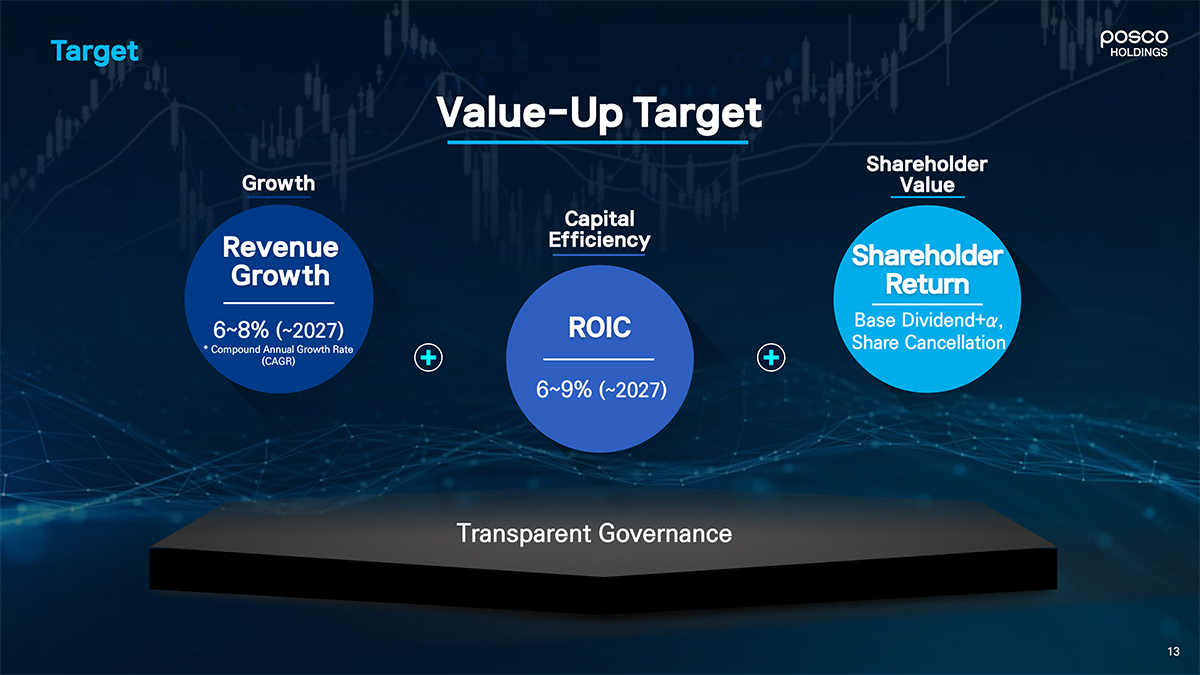
Value-Up Target Shareholder Growth Value Capital Avenue Efficiency Shareholder Growth Return 68% (-2027) ROIC cBkase Dividend+a, * compound Annual Growth Rate Share Cancellation (CAGR) 6-9% (-2027) Transparent Governance

Rationales for selecting key indicators Company is in an investment phase, allocating assets to expand its steelmaking operations overseas and grow its secondary battery materials business preparing for full-scale production mancia arge Given our diverse operations, strategic portfolio adjustments are crucial for capital efficiency. Revenue Growth + ROIC Financial Target Shareholder Return + Governance Revenue Revenue generation signifies the investment payback shareholder ‘ Given the nature of cyclical industry, providing Growth Ideal for measuring performance when investment Return stable return through base dividend and share impacts become visible cancellation is crucial, offering predictability â– Suitable for assessing portfolio performance in both business restructuring and new investments—Transparent and fair governance is fundamental â– Efficient performance measurement of invested for long-term corporate value capital, including external capital * Established value-up plan and key indicators through 4 board discussions (April, May, July, December 2024) Incorporate the key financial indicators into management evaluation and compensation To align with shareholder value, revenue, ROIC and TSR shall be used as indicators for evaluating business performance and executive compensation from 2025

Boost Corporate value by ROIC based Capital Allocation Allocate capital on high ROIC businesses with growth potential and continue decisive restructuring on low ROIC/non—core businesses (krw tn) Underperforming Restructuring Assets & Business 2.6. Restructuring Investment proportion External Financing* materials 0-5 High-ROIC Growth investment 40% Investment 30-35 New biz. 15% 10% Operating Cash Flow 25-30 Dividend Base dividend (KRW 10,000/share) 2.3+ with additional return Capital Source Capital Allocation (2025—2027) (2025—2027) * Partnership-based joint investment, debt financing, etc.
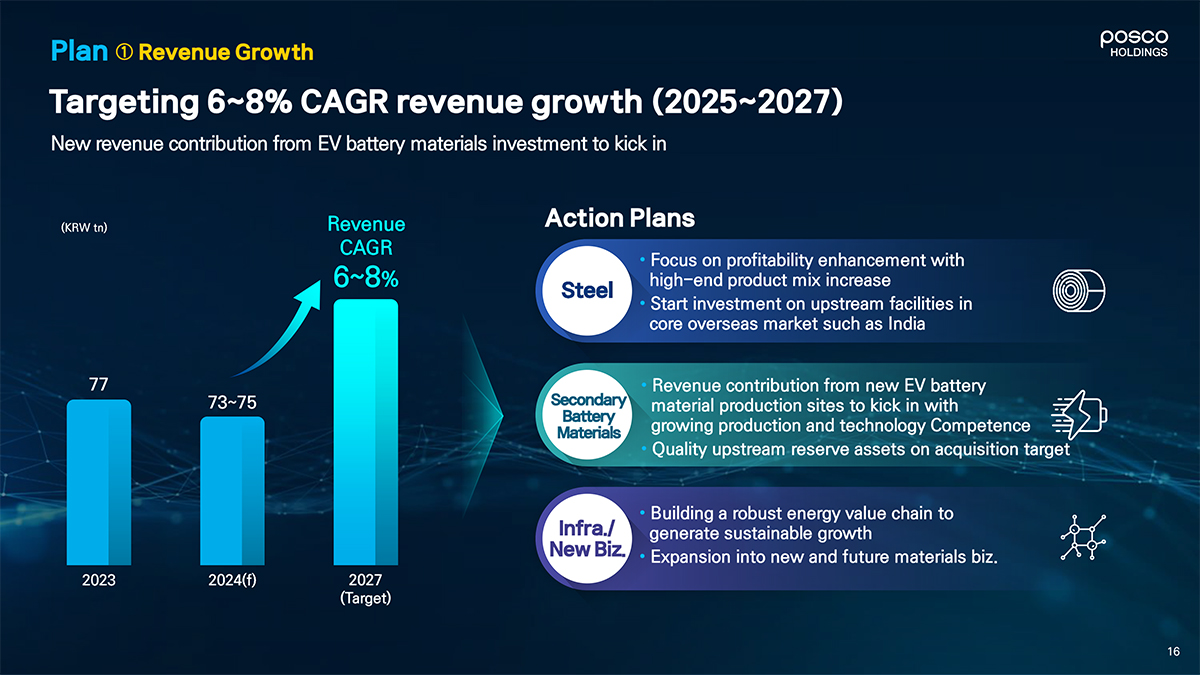
OOSCO Plan CD Revenue Growth holdings Targeting 6-8% CAGR revenue growth (2025-2027) New revenue contribution from EV battery materials investment to kick in (KRwtn) Revenue Action Plans CAGR c Focus on profitability enhancement with high-end product mix increase Start investment on upstream facilities in core overseas market such as India 77 Revenue contribution from new EV battery 73-75 material production sites to kick in with growing production and technology Competence 7 , Quality upstream reserve assets on acquisition target Building a robust energy value chain to generate sustainable growth Expansion into new and future materials biz. 2023 2024(f) 2027 (Target)
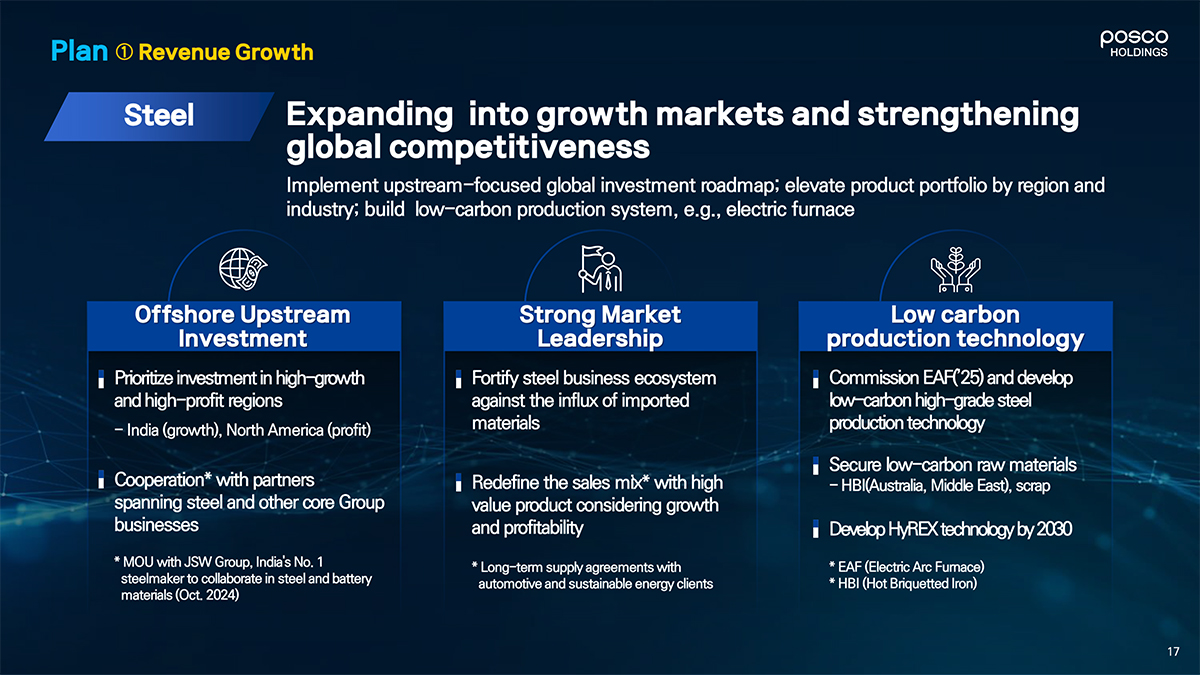
Steel Expanding into growth markets and strengthening global competitiveness Implement upstream-focused global investment roadmap; elevate product portfolio by region and industry; build low-carbon production system, e.g., electric furnace Offshore Upstream Strong Market Low carbon Investment Leadership production technology Prioritize investment in high-growth । Fortify steel business ecosystem Commission EAFC25) and develop and high-profit regions against the influx of imported low-carbon high-grade steel—India (growth), North America (profit) materials production technology Secure low-carbon raw materials Cooperation* with partners Redefine the sales mix* with high—HBI(Australia, Middle East), scrap spanning steel and other core Group value product considering growth businesses and profitability Develop HyREX technology by2080 * MOU with JSW Group, India s No. 1 * Long-term supply agreements with * EAF (Electric Arc Furnace) steelmakerto collaborate in steel and battery automotive and sustainable energy clients * HBI (Hot Briquetted Iron) materials (Oct. 2024)
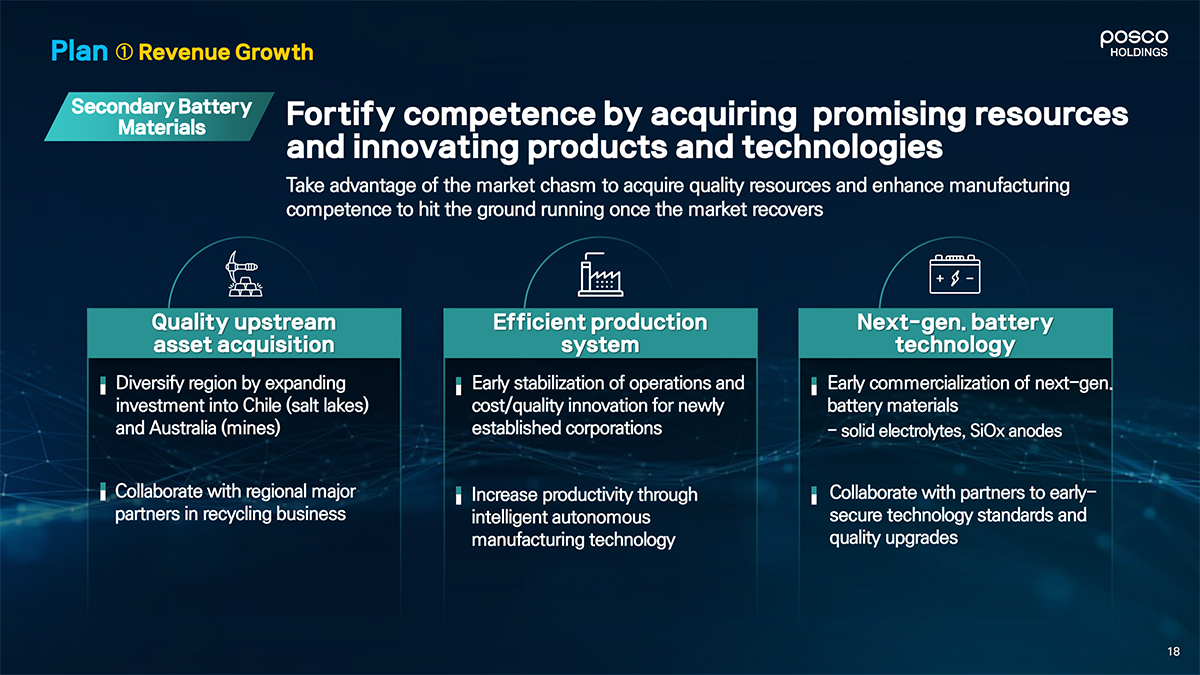
Secondary Battery Fortify competence by acquiring promising resources and innovating products and technologies Take advantage of the market chasm to acquire quality resources and enhance manufacturing competence to hit the ground running once the market recovers + —SB Quality upstream Efficient production—Next-gen. battery H asset acquisition system technology Diversify region by expanding Early stabilization of operations and Early commercialization of next-gen. investment into Chile (salt lakes) cost/quality innovation for newly battery materials and Australia (mines) established corporations—solid electrolytes, SiOx anodes Collaborate with regional major increase productivity through Collaborate with partners to early- partners in recycling business intelligent autonomous secure technology standards and manufacturing technology quality upgrades

Infra-New Biz. Support the group business growth and expand into new and future materials Energy E&C DX New Business Strengthen LNG value chain Build sustainable and high Intelligent Factory-assisted M&A in promising areas and expand terminal related value-added business Group productivity innovation such as future materials business system non Capa, expansion of Construe Expandurban Allow intelligent autonomous . E&P Myanmar pjt. and Senex -tion redevelopment projects IT manufacturing plant to Identify business domains control order to shipment aligned to Group value & Construction of 2nd LNG Reinforce EPC capabilities strategy, growth potential and Terminal terminal and expand related Plant in steel and battery Unmanned/Automated intrinsic capabilities biz.(e.g. bunkering) materials EIC K Manufacturing * Domains under review: New mobility, Sustainably Power Acquire project licenses Phase in offshore wind sourced energy, carbon abatement. generation (domestic, ASEAN) projects ’Electrical, Instrument & Control
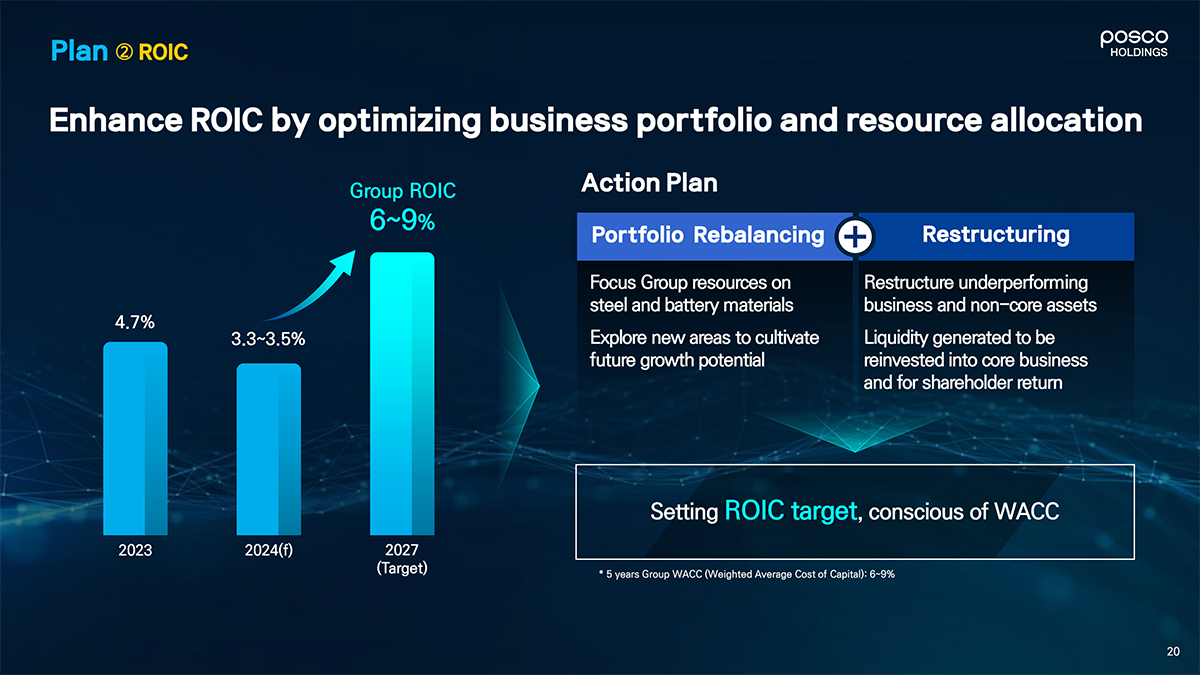
Enhance ROIC by optimizing business portfolio and resource allocation Group ROIC Action Plan Portfolio Rebalancing Restructuring Focus Group resources on Restructure underperforming steel and battery materials business and non-core assets 4.7% . 3.3- 3.5% Explore new areas to cultivate Liquidity generated to be future growth potential reinvested into core business and for shareholder return Setting ROIC target, conscious of WACC 2023 2024(f) 2027 (Target) * 5 years Group WACC (Weighted Average Cost of Capital): 6~9%
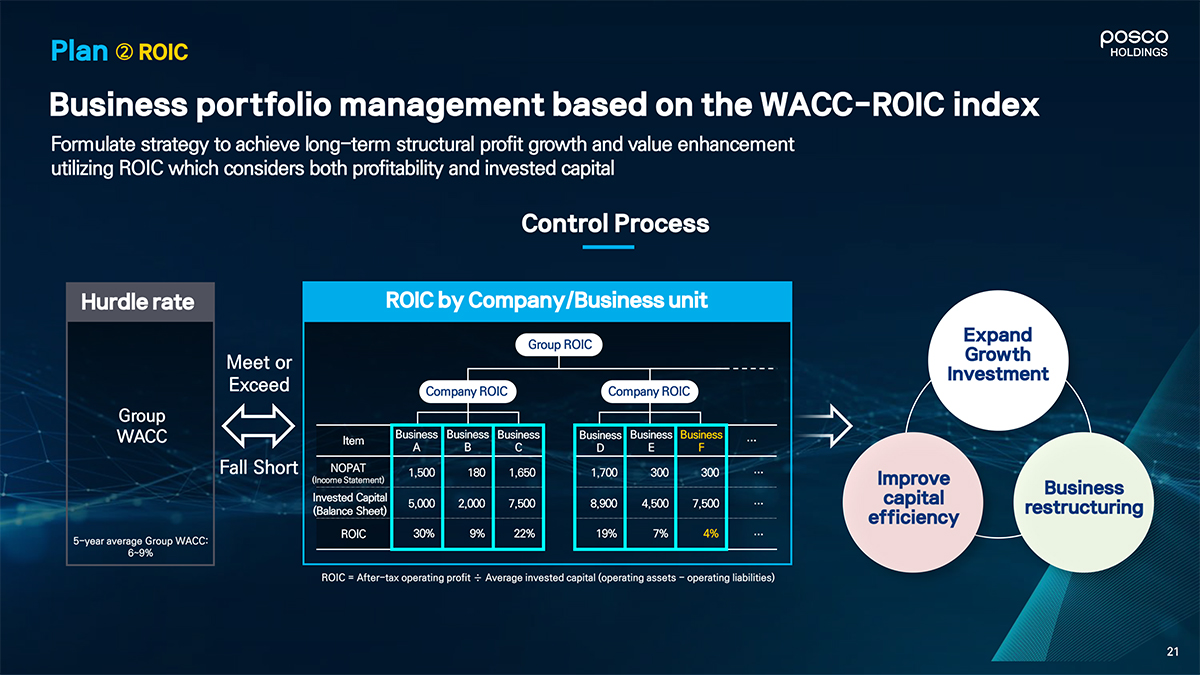
Business portfolio management based on the WACC-ROIC index Formulate strategy to achieve long-term structural profit growth and value enhancement utilizing ROIC which considers both profitability and invested capital Control Process Hurdle rate ROIC by Company/Business unit Meet or Exceed Group WACC Business Business Business Business! Business! Business Fall Short nopat 1,500 180 1650 1,700 300 300 (Income Statement) Invested Capital 5 000 2 000 7 M0 8,900 4 500 7 500 (Balance Sheet) „ p ROIC 30% 9% 22% 19% 7% 4% 5-year average Group WACC: 6~9% ROIC = After-tax operating profit r Average invested capital (operating assets—operating liabilities)
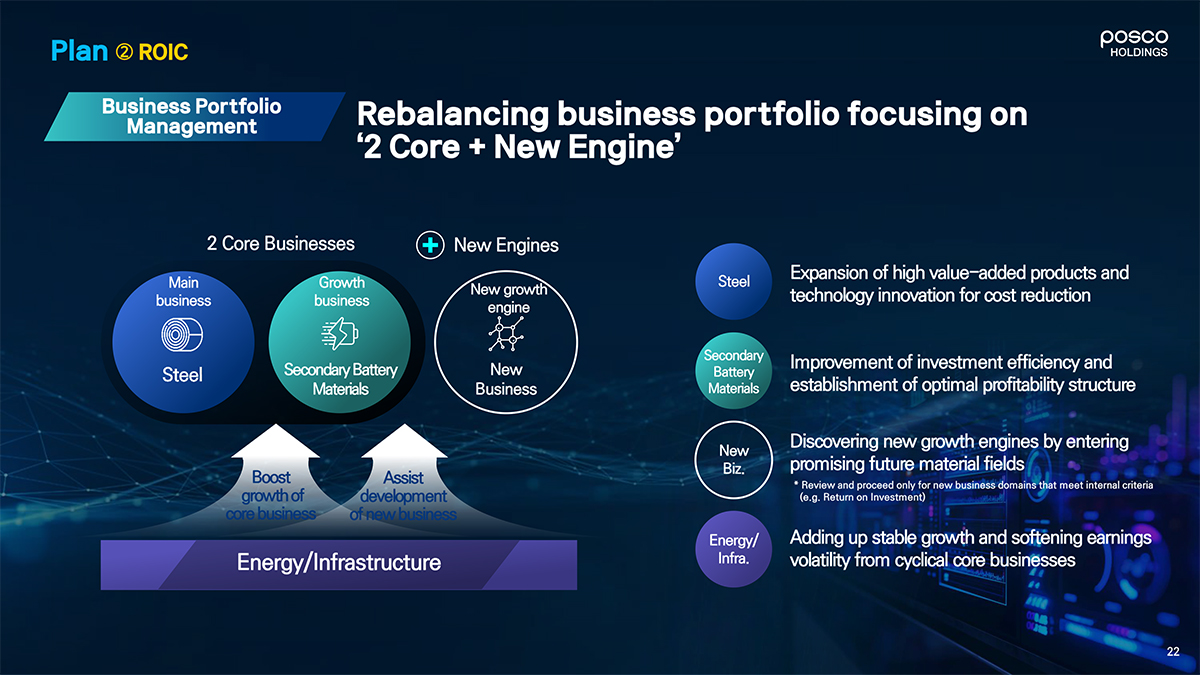
Business Portfolio Rebalancing business portfolio focusing on 2 Core + New Engine’ 2 Core Businesses New Engines Main Growth Steel Expansion of high value-added products and business busine technology innovation for cost reduction steel Secondary Battery New Improvement of investment efficiency and Materials Business Materials establishment of optimal profitability structure New Discovering new growth engines by entering Biz promising future material fields 7 * Review and proceed only for new business domains that meet internal criteria (e.g. Return on Investment) Energy/ Adding up stable growth and softening earnings Energy/lnfrastructure lnfra- volatility from cyclical core businesses

Restructuring Restructuring Underperforming and Non-core businesses/assets Reallocate restructuring proceeds (over KRW 2.6 tn) into core biz investment or additional shareholder return Restructuring Targets • Underperforming • Non-core business assets (KRW tn) Under- Cumulative performing Non core cash generation business assets 55 70 Target Goal 25 86% 32 26 98% 125+a business/assets 14 *By Q3’2024, 21 assets/businesses have been divested (KRW 625,4 bn) 36 Under- * Sold Papua New Guinea Non-core * 12 investment stocks 26 performing power plant Assets (e.g. KB Financial Group) 0 business * Sold/iquidated overseas (16 entities totaling * 4 low-yield assets low-profit subsidiaries KRW 581.2 bn) (e.g., commercial buildings) O 2024 2025 2026

pOSCO Plan Shareholder Return holdings Proactive implementation of global standard shareholder return policies 2016 2020-2022 2023 2023 -2024 1st large corporation in Korea Share buyback (KRW 1 tn) Balance corporate growth Determining dividends to initiate the program (2015) Share cancellation (3%) and reliable shareholder return before the record date Shareholder Dividend per share Consolidated dividend Retum Dividend Shareholder return ratio payout ratio 50.3% 44.7% • 44.7% 43.7% 43.7% 28.9% • 19.4% 19.4%/ 15 (KRW/Share) 10,000 12,000 10,000 * 8,000 krw tn) 0.8 13 0 8 â– 2019 2020 2021 2022 2023 2019 2020 2021 2022 2023 Shareholder return ratio : (Dividend + Share Cancellation) r Net profit attributable to controlling interest

TSR, with balanced combination of dividend and share cancellation Maximizing of shareholder value through balance between business growth and stable shareholder return Treasury share Dividend I Share Cancellation of 6% over 3 years C24-26) I 50-60% of annual FCF (parentbase) will be used to pay base dividend • 2% Shares (KRW 660 bn) has been cancelled in 2024 (KRW 10,000/share), and the remaining shall be additionally returned Established shareholder return policy based on FCF that reflects investment I Immediate share cancellation upon new share buyback going forward for future growth Introduced‘ Base Dividend’ to stabilize shareholder return in response to • Part of the proceeds from non-core asset divestment was used in 2024 uncertaintv of FCF to fund the share buyback worth of KRW 100 bn Treasury share Reduction of shares through Total Shareholder Record-high shareholder return of continuous large-scale cancellation Return KRW 4.3 tn + a over 3 years . 13.3% Buyback & (KRWtn/yr) Cancellation Existing Share Cancellation 1 4.6% Total Base Dividend Dividend 2021 202320242026(f) 2023 2024(f) 2025(f) 2026(f) * Assumptions: Base dividend (KRW 10,000) + Cancellation of 2% each year (share price of July 11,2024)

* Shareholder return in 2026 is based on maintaining current policy (2026 onwards will be reviewed later) 2 5 Governance Board of Directors H Appointment of CEO and Outside Directors ESG Governance 4 POSCO HOLIDNGS CORPORATE VALUE-UP PLAN O O O “

Board of Directors HOLDINGS All BoD committees are headed by outside directors including the chair of the board Taking the lead in appointing outside directors in 1997 and separating the roles of CEO and Chairman of the Board in 2006 Board of Directors 10 directors (6 outside, 4 inside) Includes 1 female outside director I I I I ESG Committee Audit Committee DirectorCarelate Finance Committee Compensation Committee Rec. Committee Rec. Committee • Monitor ESG—related • Evaluate management • Audit business • Review OD qualifications • Review investment, • Review candidate policy implementation performance operations & accounting • Operate OD Candidate financing & payment plans qualifications • Review internal • Review Director compen • Review financial reports Rec. Advisory Panel • Review candidate pool transactions sation and severance pay /internal control systems and development plans Inside 1 Inside 1 Outside 4 Outside 3 Outside 3 Outside 6 Outside 3 Outside 3 Key Indicators Key Indicators of Corporate Governance Category 2023 2024 ‘ POSCO Holdings complies with all key indicators* including cumulative voting, and appointment of an outside director as the chairman of the board Outside Director Ratio 58% 60% 71% Key Korean Board Meeting Frequency 10 10 holding company avg. Director Attendance Rate (avg.) 100% 98% 2022 3 POSCO Holdings Agenda items (resolved/reported) 24/ 18 27/ 14 Female Director Ratio 8% 10% 2023 100% * Corporate Governance Report 27
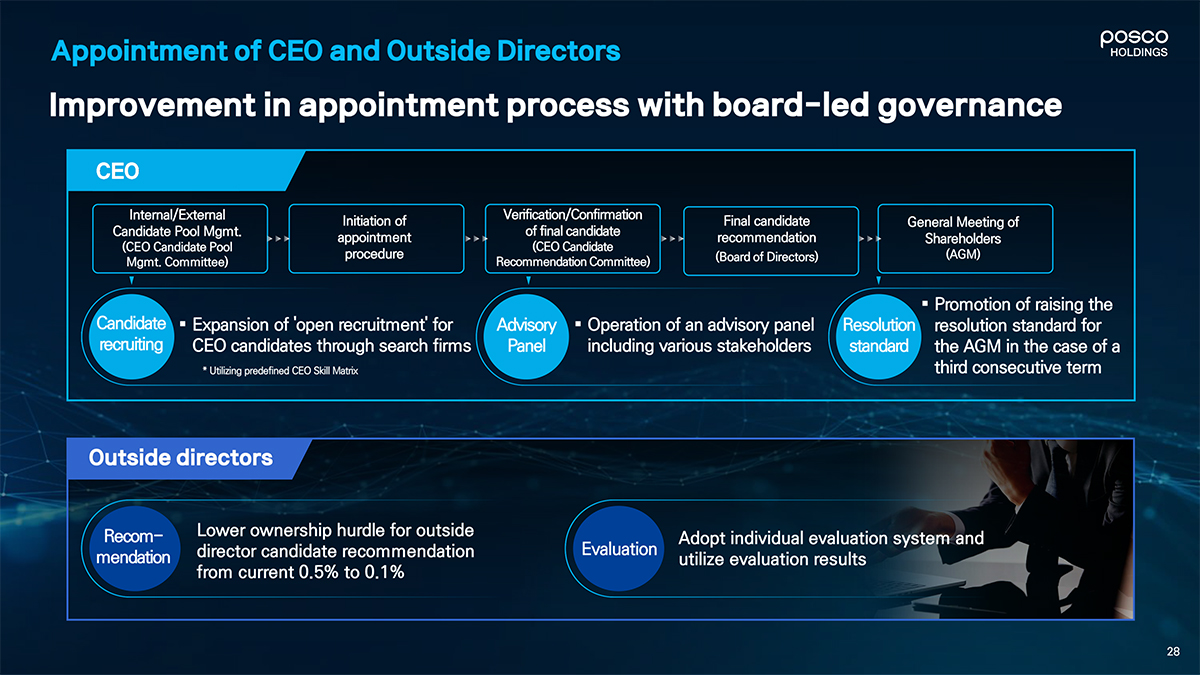
Appointment of CEO and Outside Directors HOLDINGS Improvement in appointment process with board-led governance CEO Intemal/External |nitiation of Verification/Confirmation Final candidate General Meeting of appointment recommendation Shareholders , (CEO Candidate Pool (CEO Candidate Mgmt, Committee) Recommendation Committee) (Board of Directors) (A ) Promotion of raising the Candidate â–Expansion of open recruitment for Advisory â– Operation of an advisory panel Resolution resolution standard for recruiting CEO candidates through search firms Panel including various stakeholders standard the AGM in the case of a * Utilizing predefined CEO Skill Matrix third consecutive term Outside directors Recom- Lower ownership hurdle for outside Adopt individual evaluation system and mendation Erector candidate recommendation Evaluation uti|ize evaluation results from current 0.5% to 0.1% >

Governance POSCO Holdings Board oversees ESG risks across the Group In the ESG Session, Board members and CEO of each affiliated company discuss long-term ESG strategies ESG Governance Board of Directors ; (ESG Committee) ESG Sesslon Group Level Corporate Compliance & Ethics Team (ESG) Group ESG Council Working-level Committee Subsidiary Level * Diversity, Equity, Inclusion, and Belonging

Communication—POSCO HOLIDNGS CORPORATE VALUE-UP PLAN

Communication Reinforce IR communication throughout diverse shareholders and channels Board of Directors, C-level ESG investors Earnings Release Sustainability Report Transparent disclosure of ESG in English “ management performance Direct communication of ESG C-Level & BoD IR Corporate Governance Achieving 100% compliance rate and business strategies 17 investors (2023), 21 (2024) Report on 15 key indicators (Since2017) Shared business initiatives and u Value Dav ESG N DR Investor communication mid to long-term strategies by (Korea, overseas) 54 investors(2023), 75(2024) focusing on ESG issues key business segments posco HOLDINGS IR / Information Disclosure Build stronger trust through NDR “ Compliance with timely and regular communication with .... t Disclosure transparent disclosures in Korea investors and the U.S. Conferences IR Provide IR data in both Korean and Expanding the investor base 508 jnvestors (2023) 385 (2024) Company websrte Eng|jsh diVerse communication General Meeting of IR YouTube channel 172 videos of core businesses broadcasting online Shareholders (Since 2023) uploaded with English subtitles
posco HOLDINGS Thank You * Above information is based on simple aggregation that includes internal transactions; the ‘Others’ segment (15 companies including POSCO Holdings) has been excluded