
United Airlines Series 2023 - 1 EETC June 12, 2023 Investor Presentation

2 The issuer has filed a registration statement (including a prospectus) with the SEC for the offering to which this communication relates . Before you invest, you should read the prospectus in that registration statement and other documents the issuer has filed with the SEC for more complete information about the issuer and this offering . You may get these documents for free by visiting EDGAR on the SEC Web site at www . sec . gov . Alternatively, the issuer, any underwriter, or any dealer participating in the offering will arrange to send you the prospectus if you request it by calling Citigroup Global Markets Inc . toll free at 1 ( 212 ) 723 - 6171 , Credit Suisse Securities (USA) LLC at 1 ( 800 ) 221 - 1037 , Deutsche Bank Securities Inc . toll free at 1 ( 800 ) 503 - 4611 or Goldman Sachs & Co . LLC toll free at 1 ( 201 ) 793 - 5170 . This presentation shall not constitute an offer to sell or the solicitation of any offer to buy, nor shall there be any sale of securities, in any jurisdiction in which such offer, solicitation or sale would be unlawful prior to the registration or qualification of such securities under the securities law of any such jurisdiction . Generally, rating agencies base their ratings on such material and information, and such of their own investigations, studies and assumptions, as they deem appropriate . The rating of the Certificates (as defined herein) should be evaluated independently from similar ratings of other securities . A credit rating of a security is not a recommendation to buy, sell or hold securities and may be subject to review, revision, suspension, reduction or withdrawal at any time by the assigning rating agency . No report of any rating agency is incorporated by reference herein . Forward - Looking Statements This presentation may contain statements about the issuer’s future plans and prospects that constitute forward - looking statements for purposes of the safe harbor provisions under the Private Securities Litigation Reform Act of 1995 . Actual results may differ materially from those in forward - looking statements as a result of various important factors, including those discussed in the issuer’s most recent Annual Report on Form 10 - K for the year ended December 31 , 2022 , as updated by its subsequent Quarterly Report on Form 10 - Q for the period ended March 31 , 2023 and other filings with the SEC . These documents are available on the SEC’s website, on the issuer’s website or from the issuer’s Investor Relations group . In addition, any forward - looking statements contained in this presentation represent the issuer’s opinions only as of the date hereof and should not be relied upon as representing the issuer’s opinions as of any subsequent date . While the issuer may elect to update forward - looking statements at some point in the future, the issuer specifically disclaims any obligation to do so, even if its estimates change . Use of Non - GAAP Financial Information and Financial Guidance The issuer refers to financial measures that are not in accordance with U . S . Generally Accepted Accounting Principles (GAAP) . The non - GAAP financial measures are provided as information supplemental to the financial measures presented in this presentation that are calculated and presented in accordance with GAAP and are presented because management believes they supplement or enhance management’s, analysts’ and investors’ overall understanding of the issuer’s underlying financial performance and trends and facilitate comparisons among current, past and future periods . Because the non - GAAP financial measures are not calculated in accordance with GAAP, they should not be considered superior to and are not intended to be considered in isolation or as a substitute for the related GAAP financial measures presented in the issuer’s filings with the SEC and may not be the same as or comparable to similarly titled measures presented by other companies due to possible differences in method and in the items being adjusted . The issuer encourages investors to review its financial statements and publicly - filed reports in their entirety and not to rely on any single financial measure . The issuer does not provide a reconciliation of forward - looking measures where the issuer believes such a reconciliation would imply a degree of precision and certainty that could be confusing to investors or is unable to reasonably predict certain items contained in the GAAP measures without unreasonable efforts . This is due to the inherent difficulty of forecasting the timing or amount of various items that have not yet occurred and are out of the issuer's control or cannot be reasonably predicted . For the same reasons, the issuer is unable to address the probable significance of the unavailable information . Forward - looking non - GAAP financial measures provided without the most directly comparable GAAP financial measures may vary materially from the corresponding GAAP financial measures . Additional Information measures used reconciled in an appendix to the
Agenda 2. Company Update 3. Aircraft Collateral Summary 1. EETC Overview Appendix A – Additional Aircraft Characteristics Appendix B – United’s Fleet & EETC Program Appendix C – Reconciliation of GAAP to Non - GAAP Financial Measures

1. EETC Overview
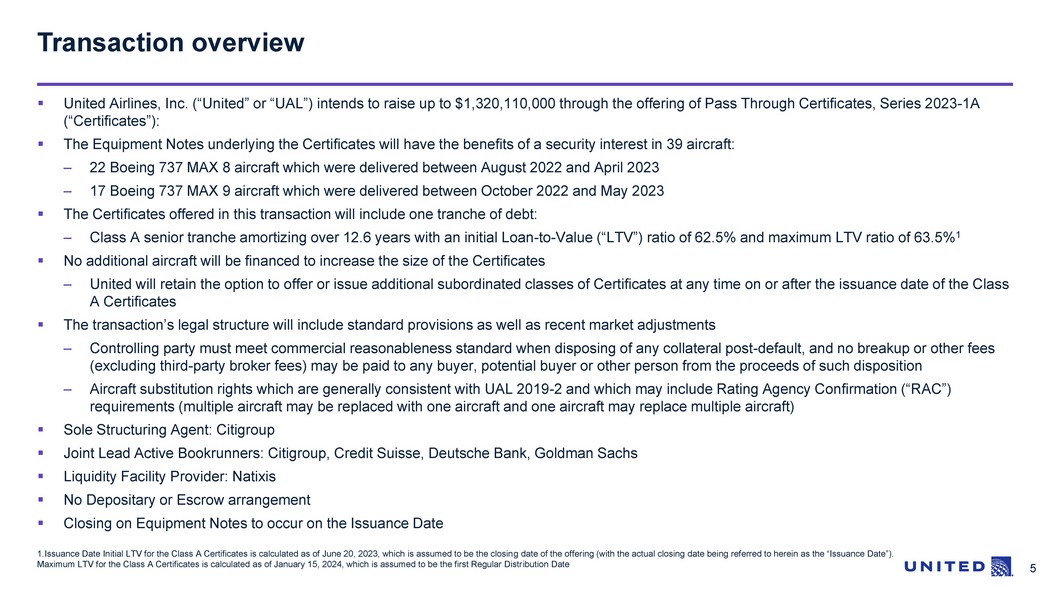
5 1.Issuance Date Initial LTV for the Class A Certificates is calculated as of June 20, 2023, which is assumed to be the closin g d ate of the offering (with the actual closing date being referred to herein as the “Issuance Date”). Maximum LTV for the Class A Certificates is calculated as of January 15, 2024, which is assumed to be the first Regular Distr ibu tion Date ▪ United Airlines, Inc. (“United” or “UAL”) intends to raise up to $1,320,110,000 through the offering of Pass Through Certific ate s, Series 2023 - 1A (“Certificates”): ▪ The Equipment Notes underlying the Certificates will have the benefits of a security interest in 39 aircraft: – 22 Boeing 737 MAX 8 aircraft which were delivered between August 2022 and April 2023 – 17 Boeing 737 MAX 9 aircraft which were delivered between October 2022 and May 2023 ▪ The Certificates offered in this transaction will include one tranche of debt: – Class A senior tranche amortizing over 12.6 years with an initial Loan - to - Value (“LTV”) ratio of 62.5% and maximum LTV ratio of 63.5% 1 ▪ No additional aircraft will be financed to increase the size of the Certificates – United will retain the option to offer or issue additional subordinated classes of Certificates at any time on or after the i ssu ance date of the Class A Certificates ▪ The transaction’s legal structure will include standard provisions as well as recent market adjustments – Controlling party must meet commercial reasonableness standard when disposing of any collateral post - default, and no breakup or other fees (excluding third - party broker fees) may be paid to any buyer, potential buyer or other person from the proceeds of such disposit ion – Aircraft substitution rights which are generally consistent with UAL 2019 - 2 and which may include Rating Agency Confirmation (“R AC”) requirements (multiple aircraft may be replaced with one aircraft and one aircraft may replace multiple aircraft) ▪ Sole Structuring Agent: Citigroup ▪ Joint Lead Active Bookrunners: Citigroup, Credit Suisse, Deutsche Bank, Goldman Sachs ▪ Liquidity Facility Provider: Natixis ▪ No Depositary or Escrow arrangement ▪ Closing on Equipment Notes to occur on the Issuance Date Transaction overview

6 United Series 2023 - 1 EETC structural summary 2023 - 1 Class A Face Amount $1,320,110,000 Requested Ratings (Moody’s / S&P) A3 / A Initial LTV / Max LTV 1 62.5% / 63.5% Weighted Average Life (years) 9.5 Regular Distribution Dates January 15 / July 15 Final Expected Distribution Date 2 January 15 , 2036 Final Maturity 3 July 15, 2037 Section 1110 Protection Yes Liquidity Facility Three semi - annual interest payments 1. Initial LTV for the Class A Certificates is calculated as of June 20, 2023 which is assumed to be the Issuance Date. Maxim um LTV for the Class A Certificates is calculated as of January 15, 2024, which is assumed to be the first Regular Distribution Date. 2. The Equipment Notes will mature on the Final Expected Distribution Date for the Certificates. 3. The Final Maturity Date for the Certificates is the date that is 18 months after the Final Expected Distribution Date for the Certificates, which represents the period corresponding to the applicable Liquidity Facility coverage of three successive semi - annual interest payments.

7 Key structural elements Cross - Collateralization and Cross - Default ▪ The Equipment Notes will be cross - collateralized by all aircraft in the collateral ▪ All indentures will include cross - default provisions Buyout Rights ▪ After a Certificate Buyout Event, if subordinated Certificates have been issued, holders thereof shall have the right to purc has e all (but not less than all) of then - outstanding more senior classes of Certificates at par plus accrued and unpaid interest Waterfall ▪ Same waterfall structure before and after an event of default Requirements for Exercise of Remedies ▪ Standard limitations on Controlling Parties’ ability to exercise remedies, consistent with recent EETCs issued by United and cer tain market updates ▪ Dispositions of collateral expressly required to be executed in a commercially reasonable manner pursuant to Article 9 of the Un ited States Uniform Commercial Code (“UCC”), and no break - up fees or other fees (excluding third - party broker fees) may be paid to any buyer, potential buyer or oth er person from the proceeds of such dispositions Substitution Rights ▪ Prior to the Issuance Date, United may, subject to obtaining a RAC and certain additional conditions, substitute any aircraft th at ceases to be in the condition required for financing under the offering with an aircraft of the same model, or, subject to certain further conditions, one or more aircr aft of a different model and/or manufacturer ▪ Following the financing of the aircraft pursuant to offering, United may substitute airframes and engines on terms generally con sistent with UAL 2019 - 2, including, in the case an airframe substitution, terms requiring that i ) each substitute airframe has a manufacture date that is no more than one year prior to manufacture date of the airframe being replaced, ii) the appraised maintenance - adjusted current market value of the substitute airframe (or substitute airframes collectively) is not less than that of the airframe (or airframes collectively) being replaced pursuant to such substitution, and iii) except in the case of a substitut ion for an airframe of the same or improved model, a RAC is obtained Additional Certificates ▪ United has the right to issue additional subordinated classes of Certificates on or after the Issuance Date

2. Company Update
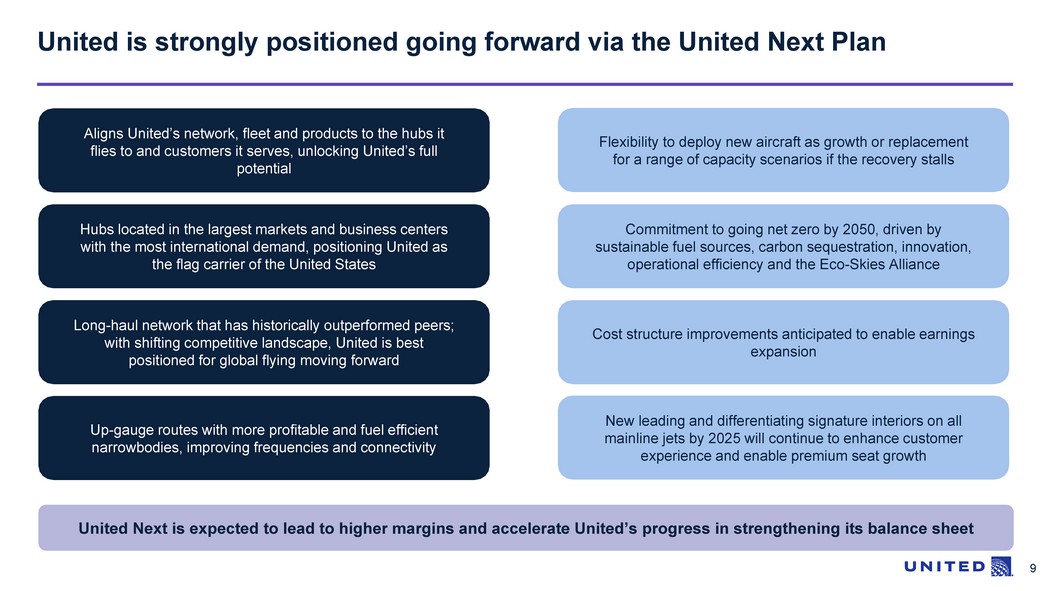
9 United is strongly positioned going forward via the United Next Plan United Next is expected to lead to higher margins and accelerate United’s progress in strengthening its balance sheet Aligns United’s network, fleet and products to the hubs it flies to and customers it serves, unlocking United’s full potential Hubs located in the largest markets and business centers with the most international demand, positioning United as the flag carrier of the United States Long - haul network that has historically outperformed peers ; with shifting competitive landscape, United is best positioned for global flying moving forward Up - gauge routes with more profitable and fuel efficient narrowbodies, improving frequencies and connectivity Cost structure improvements anticipated to enable earnings expansion Flexibility to deploy new aircraft as growth or replacement for a range of capacity scenarios if the recovery stalls New leading and differentiating signature interiors on all mainline jets by 2025 will continue to enhance customer experience and enable premium seat growth Commitment to going net zero by 2050, driven by sustainable fuel sources, carbon sequestration, innovation, operational efficiency and the Eco - Skies Alliance

10 United has bolstered liquidity through efficient mix of debt issuances 2026 2025 2023 3.4 2024 2027 5.2 2.9 3.9 2.4 Annual debt payments ($B) 2 1. Source: Form 10 - Q for United Airlines Holdings, Inc. for quarterly period ended March 31, 2023 2. Source: Form 10 - K for United Airlines Holdings, Inc. for fiscal year ended December 31, 2022 9.5 7.6 1.8 18.9 Short - term investments Cash & cash equivalents Undrawn revolver Liquidity ($B) 1 ▪ United maintains strong liquidity profile – nearly $19B as of Q1 2023 ▪ United invests its cash conservatively predominantly through U.S. Treasuries and government money market funds ▪ Cash & cash equivalents provide daily liquidity source ▪ $1.75B undrawn and available under revolving credit facility Manageable upcoming debt amortization schedule

11 United is committed to reducing net debt and leverage 18.7 17.7 25.7 0.0 5.0 10.0 15.0 20.0 25.0 30.0 2019 2020 2021 25.6 Adjusted Net Debt 1 ($B) Adjusted Net Debt 1 to Adjusted EBITDAR 2 0.0 0.5 1.0 1.5 2.0 2.5 3.0 3.5 4.0 4.5 2022 2018 2.5x 3.0x 2023 United Next Target 3 2018 1. Adjusted Net D ebt is a non - GAAP financial measure defined as adjusted total debt net of cash and short - term investments. Adjusted total debt is a non - GAAP financial measure that includes current and long - term debt, operating lease obligations and finance lease obligations, current and noncurrent other financial liabilities and noncurrent pension and postretirement obligations. See Appendix C for a reconciliation of the histo ri cal non - GAAP financial measures to the most comparable GAAP financial measures 2. Adjusted EBITDAR is a non - GAAP financial measure that measures adjusted earnings before interest, income taxes, depreciation, am ortization, aircraft rent and excluding special charges, and unrealized (gains) losses on investments. See Appendix C for a reconciliation of the historical non - GAAP financial measures to the most comparable GAAP financial measures; United Next Tar get as of January 17, 2023 3. The 2023 United Next Target is not the Company’s projection of future performance, and is based on number of significant a ssu mptions; no assurance can be given that the company will meet its target 2022 22.3 4.3x < 3.0x 2019 21.5 1Q23 LTM 1Q23 3.2x
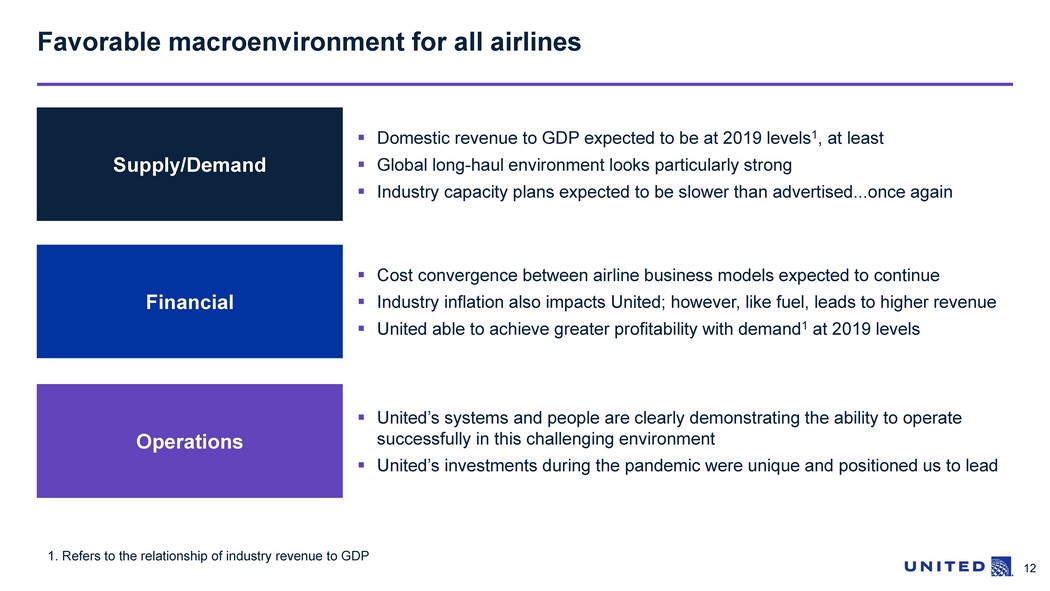
12 Favorable macroenvironment for all airlines ▪ Domestic revenue to GDP expected to be at 2019 levels 1 , at least ▪ Global long - haul environment looks particularly strong ▪ Industry capacity plans expected to be slower than advertised...once again Supply/Demand Financial Operations ▪ Cost convergence between airline business models expected to continue ▪ Industry inflation also impacts United; however, like fuel, leads to higher revenue ▪ United able to achieve greater profitability with demand 1 at 2019 levels ▪ United’s systems and people are clearly demonstrating the ability to operate successfully in this challenging environment ▪ United’s investments during the pandemic were unique and positioned us to lead 1. Refers to the relationship of industry revenue to GDP

13 Expect revenue to GDP relationship to recover at least to 2019 levels ▪ 2023 nominal GDP expected to be up ~24% 2 versus 2019 ▪ United achieved pre - tax margin and adjusted pre - tax margin 3 of 9% in 2H22 2022 2021 2020 2019 2011 - 2018 2001 - 2010 2023E 0.71 % 0.54% 0.49% 0.49% 0.19% 0.30% 0.45% 0.49% 1990 - 2000 Industry domestic revenue as % of GDP 1 1. Data sourced from Department of Transportation and internal outlook. 2. Source: IHS Global Insight 3. Actual adjusted pre - tax margin of 8.9% in 2H22; adjusted pre - tax margin is a non - GAAP financial measure calculated as pre - tax ma rgin, excluding operating and nonoperating special charges (credits) and unrealized (gains) losses on investments, net. See Appendix C for a reconciliation of the historical no n - G AAP financial measures to the most comparable GAAP measures. Implies ~15% revenue growth YOY Cost convergence may drive i ndustry revenues back to prior, higher levels of revenue/GDP
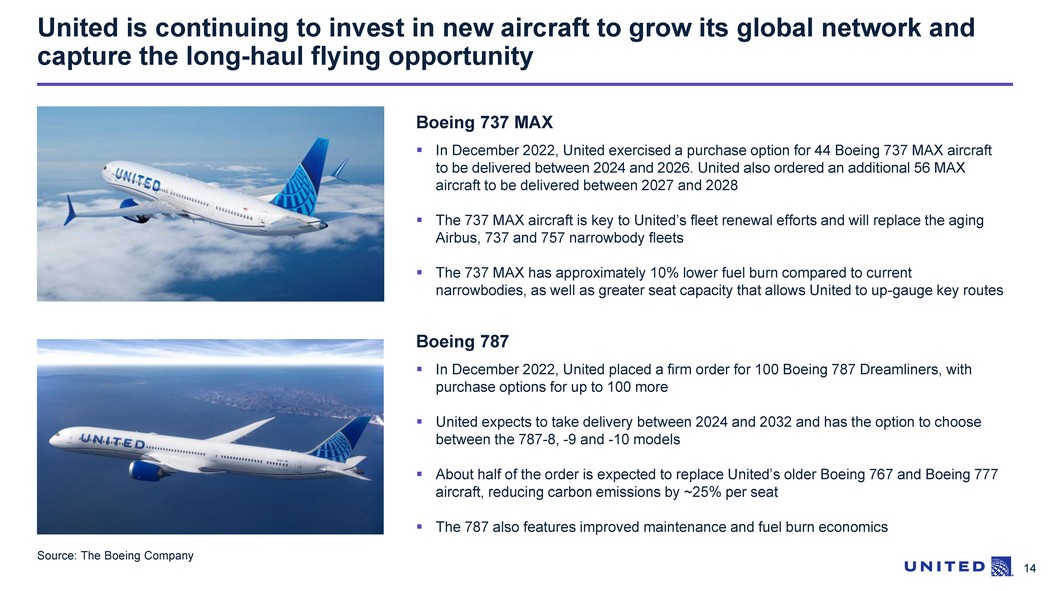
14 United is continuing to invest in new aircraft to grow its global network and capture the long - haul flying opportunity Boeing 737 MAX ▪ In December 2022, United exercised a purchase option for 44 Boeing 737 MAX aircraft to be delivered between 2024 and 2026. United also ordered an additional 56 MAX aircraft to be delivered between 2027 and 2028 ▪ The 737 MAX aircraft is key to United’s fleet renewal efforts and will replace the aging Airbus, 737 and 757 narrowbody fleets ▪ The 737 MAX has approximately 10% lower fuel burn compared to current narrowbodies, as well as greater seat capacity that allows United to up - gauge key routes Source: The Boeing Company Boeing 787 ▪ In December 2022, United placed a firm order for 100 Boeing 787 Dreamliners, with purchase options for up to 100 more ▪ United expects to take delivery between 2024 and 2032 and has the option to choose between the 787 - 8, - 9 and - 10 models ▪ About half of the order is expected to replace United’s older Boeing 767 and Boeing 777 aircraft, reducing carbon emissions by ~25% per seat ▪ The 787 also features improved maintenance and fuel burn economics

15 United Next aircraft order will enable premium seat growth and better match hub demographics 104 146 2019 2026 E 40% Total seats per short - haul departure North America mainline + regional fleet 15 E Estimated, based on internal delivery and retirement projections; Reflects plans as of March 15, 2022 er to Disclaimer; Guidance as 1. CASM - ex (adjusted cost or operating expense per available seat mile) is a non - GAAP financial measure that excludes fuel, profit sharing, third - party business expenses and special charges (credits); the Company is not providing a target for or reconciliation to CASM, the most directly comparable GAAP mea sur e, because the Company is unable to predict certain items contained in the GAAP measure without unreasonable efforts; Reflects plans as of March 15, 2022 59 2026 E 2019 31 ~2x Premium seats per short - haul departure North America fleet Economy Plus® United First SM Premium seating will grow faster than non - premium Efficient growth will enable 2026 CASM - ex 1 ~(8%) below 2019

16 Global long - haul margins expected to grow in 2023 with industry capacity reset to 2019 levels Network peers 1 UA Leading global airlines 1 +12% (9%) (5%) Widebody fleet count YE22 vs. YE19 United will lean into global long - haul in 2023 – consistent with plans since early days of the pandemic ~20% Atlantic GDP Growth (2023E vs 2019) 2 UA Atlantic Capacity Growth (2023E vs 2019) 3 Industry Atlantic Capacity (2023E vs 2019) 3 1 % 36 % 1. Network peers includes American and Delta; leading global airlines includes Emirates, Qatar, British Airways, Cathay Pacific, Lu fthansa, Air France/KLM, Singapore Airlines, Air Canada, Air China and Turkish Airlines 2. Average of US and Atlantic GDP Growth, weighted by July 2023 industry nonstop capacity – source: SP Global/ Diio ; Expectation as of January 17, 2023 3. USA to Atlantic Markets July 2023 vs July 2019 (2019 baseline adjusted to include suspended India flying) – source: Diio ; Expectation as of January 17, 2023 United was the only major airline 1 to not retire widebody aircraft or downgrade pilots during the pandemic… …and is now set up to take advantage of strong market fundamentals

17 United’s hubs are in the largest markets and business centers, with the strongest international demand New York Chicago Los Angeles Atlanta San Francisco Miami Denver Dallas Washington D.C. Houston Seattle Minneapolis Passenger demand Total passengers – YE 2019 United’s hubs are a unique demographic advantage, positioning United as the U.S. flag carrier Miami San Francisco Seattle Chicago New York Los Angeles Washington D.C. Houston Atlanta Dallas Denver Philadelphia Long - haul passenger demand International passengers – YE 2019 Washington D.C. San Francisco New York Los Angeles Chicago Houston Miami Atlanta Dallas Seattle Denver Detroit Premium passenger demand Premium passengers – YE 2019 Source: 2019 MIDT, data organized by metro area
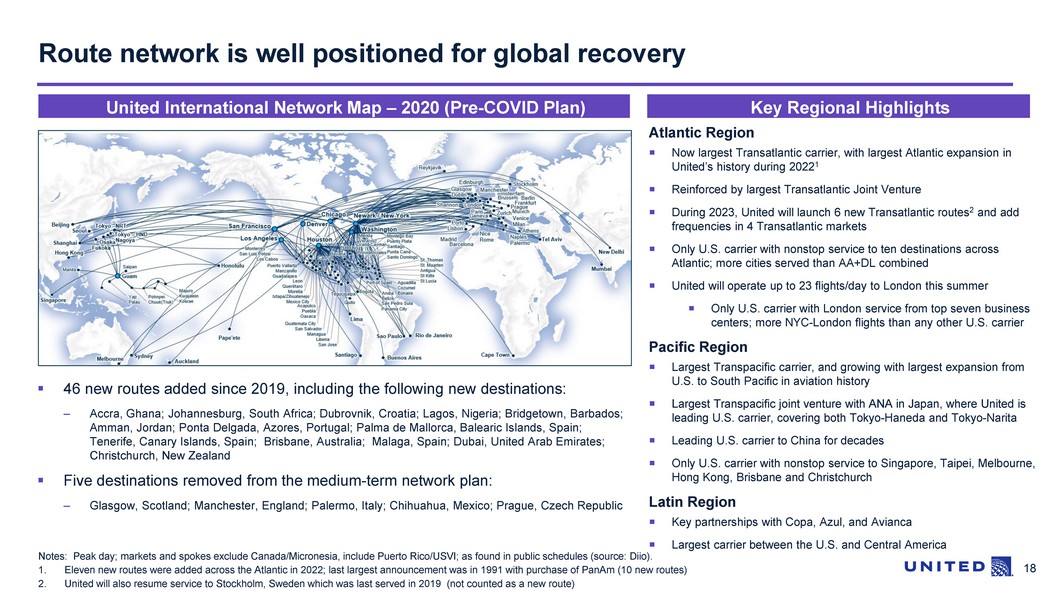
18 Route network is well positioned for global recovery Notes: Peak day; markets and spokes exclude Canada/Micronesia, include Puerto Rico/USVI; as found in public schedules (sourc e: Diio ). 1. Eleven new routes were added across the Atlantic in 2022 ; last largest announcement was in 1991 with purchase of PanAm (10 new routes) 2. United will also resume service to Stockholm, Sweden which was last served in 2019 (not counted as a new route) A tlantic Region Now largest Transatlantic carrier, with largest Atlantic expansion in United’s history during 2022 1 Reinforced by l argest Transatlantic Joint Venture During 2023, United will launch 6 new Transatlantic routes 2 and add frequencies in 4 Transatlantic markets Only U.S. carrier with nonstop service to ten destinations across Atlantic; more cities served than AA+DL combined United will operate up to 23 flights/day to London this summer Only U.S. carrier with London service from top seven business centers ; more NYC - London flights than any other U.S. carrier Pacific Region Largest Transpacific carrier, and growing with largest expansion from U.S. to South Pacific in aviation history Largest Transpacific joint venture with ANA in Japan, where United is leading U.S. carrier, covering both Tokyo - Haneda and Tokyo - Narita Leading U.S. carrier to China for decades Only U.S. carrier with nonstop service to Singapore, Taipei, Melbourne, Hong Kong, Brisbane and Christchurch Latin Region Key partnerships with Copa, Azul, and Avianca Largest carrier between the U.S. and Central America United International Network Map – 2020 (Pre - COVID Plan) Key Regional Highlights ▪ 46 new routes added since 2019, including the following new destinations: – Accra, Ghana; Johannesburg, South Africa; Dubrovnik, Croatia; Lagos, Nigeria; Bridgetown, Barbados; Amman, Jordan; Ponta Delgada, Azores, Portugal; Palma de Mallorca, Balearic Islands, Spain; Tenerife, Canary Islands, Spain; Brisbane, Australia; Malaga, Spain; Dubai, United Arab Emirates; Christchurch, New Zealand ▪ Five destinations removed from the medium - term network plan: – Glasgow, Scotland; Manchester, England; Palermo, Italy; Chihuahua, Mexico; Prague, Czech Republic

3. Aircraft Collateral Summary

20 Base Value ($mm) Aircraft No. Aircraft Type Narrow / Widebody Manufacturer's Serial Number Engine Type Delivery Month ASG BK mba LMM 1 737 MAX 8 Narrowbody 67523 LEAP - 1B28 Aug - 22 51,288,214 54,484,212 52,800,000 52,800,000 2 737 MAX 8 Narrowbody 67526 LEAP - 1B28 Sep - 22 51,288,214 54,790,871 53,080,000 53,053,028 3 737 MAX 8 Narrowbody 67524 LEAP - 1B28 Sep - 22 51,288,214 54,790,871 53,080,000 53,053,028 4 737 MAX 8 Narrowbody 64610 LEAP - 1B28 Sep - 22 51,288,214 54,790,871 53,080,000 53,053,028 5 737 MAX 8 Narrowbody 67525 LEAP - 1B28 Sep - 22 51,288,214 54,790,871 53,080,000 53,053,028 6 737 MAX 8 Narrowbody 67522 LEAP - 1B28 Sep - 22 51,288,214 54,790,871 53,080,000 53,053,028 7 737 MAX 8 Narrowbody 67527 LEAP - 1B28 Sep - 22 51,288,214 54,790,871 53,080,000 53,053,028 8 737 MAX 8 Narrowbody 67528 LEAP - 1B28 Oct - 22 52,071,024 55,097,530 53,350,000 53,350,000 9 737 MAX 8 Narrowbody 62535 LEAP - 1B28 Oct - 22 52,071,024 55,097,530 53,350,000 53,350,000 10 737 MAX 8 Narrowbody 64612 LEAP - 1B28 Nov - 22 52,071,024 55,404,189 53,620,000 53,620,000 11 737 MAX 8 Narrowbody 61861 LEAP - 1B28 Dec - 22 52,071,024 55,710,848 53,890,000 53,890,000 12 737 MAX 8 Narrowbody 61863 LEAP - 1B28 Dec - 22 52,071,024 55,710,848 53,890,000 53,890,000 13 737 MAX 8 Narrowbody 64613 LEAP - 1B28 Dec - 22 52,071,024 55,710,848 53,890,000 53,890,000 14 737 MAX 8 Narrowbody 64611 LEAP - 1B28 Dec - 22 52,071,024 55,710,848 53,890,000 53,890,000 15 737 MAX 8 Narrowbody 61853 LEAP - 1B28 Dec - 22 52,071,024 55,710,848 53,890,000 53,890,000 Aircraft collateral summary – base values 1 1. Weighted by the LMM of the maintenance adjusted appraised base values of the aircraft as appraised by Aviation Specialists Group, Inc. (“ASG”), BK Associates, Inc. (“BK”), and mba Aviation (“ mba ”) as of March 31, 2023 2. Minimum collateral cushion is calculated as of January 15, 2024, the Regular Distribution Date with the Maximum LTV set fo rth under “Loan to Aircraft Value Ratios” in the Summary of the Preliminary Prospectus Supplement. ▪ United has obtained base value desktop appraisals from three appraisers (ASG, BK, mba ) ▪ Aggregate aircraft appraised value of approximately $2,112.2 million . Appraisals available in the Preliminary Prospectus Supplement ▪ Appraisals indicate a minimum collateral cushion of 36.5% on the Certificates 2 , which increases over time as the Certificates debt amortizes

21 Aircraft collateral summary – base values 1 (cont.) 1. Weighted by the LMM of the maintenance adjusted appraised base values of the aircraft as appraised by ASG, BK and mba as of March 31, 2023 Base Value ($mm) Aircraft No. Aircraft Type Narrow / Widebody Manufacturer's Serial Number Engine Type Delivery Month ASG BK mba LMM 16 737 MAX 8 Narrowbody 61854 LEAP - 1B28 Feb - 23 52,870,050 57,770,937 54,230,000 54,230,000 17 737 MAX 8 Narrowbody 64614 LEAP - 1B28 Feb - 23 52,870,050 57,770,937 54,230,000 54,230,000 18 737 MAX 8 Narrowbody 61859 LEAP - 1B28 Feb - 23 52,870,050 57,770,937 54,230,000 54,230,000 19 737 MAX 8 Narrowbody 61856 LEAP - 1B28 Mar - 23 52,870,050 58,077,596 54,280,000 54,280,000 20 737 MAX 8 Narrowbody 60709 LEAP - 1B28 Mar - 23 52,870,050 58,077,596 54,280,000 54,280,000 21 737 MAX 8 Narrowbody 61857 LEAP - 1B28 Apr - 23 53,063,500 58,247,380 54,320,000 54,320,000 22 737 MAX 8 Narrowbody 60712 LEAP - 1B28 Apr - 23 53,063,500 58,247,380 54,320,000 54,320,000 23 737 MAX 9 Narrowbody 64468 LEAP - 1B28 Oct - 22 53,195,780 55,068,924 54,280,000 54,181,568 24 737 MAX 9 Narrowbody 64470 LEAP - 1B28 Nov - 22 53,195,780 55,381,333 54,550,000 54,375,704 25 737 MAX 9 Narrowbody 64469 LEAP - 1B28 Nov - 22 53,195,780 55,381,333 54,550,000 54,375,704 26 737 MAX 9 Narrowbody 64467 LEAP - 1B28 Nov - 22 53,195,780 55,381,333 54,550,000 54,375,704 27 737 MAX 9 Narrowbody 64474 LEAP - 1B28 Dec - 22 53,195,780 55,693,743 54,830,000 54,573,174 28 737 MAX 9 Narrowbody 64473 LEAP - 1B28 Dec - 22 53,195,780 55,693,743 54,830,000 54,573,174 29 737 MAX 9 Narrowbody 64472 LEAP - 1B28 Dec - 22 53,195,780 55,693,743 54,830,000 54,573,174 30 737 MAX 9 Narrowbody 64478 LEAP - 1B28 Dec - 22 53,195,780 55,693,743 54,830,000 54,573,174 31 737 MAX 9 Narrowbody 64477 LEAP - 1B28 Dec - 22 53,195,780 55,693,743 54,830,000 54,573,174 32 737 MAX 9 Narrowbody 64476 LEAP - 1B28 Dec - 22 53,195,780 55,693,743 54,830,000 54,573,174 33 737 MAX 9 Narrowbody 67578 LEAP - 1B28 Feb - 23 54,302,999 58,287,589 55,180,000 55,180,000 34 737 MAX 9 Narrowbody 67181 LEAP - 1B28 Mar - 23 54,302,999 58,599,999 55,230,000 55,230,000 35 737 MAX 9 Narrowbody 67180 LEAP - 1B28 Mar - 23 54,302,999 58,599,999 55,230,000 55,230,000 36 737 MAX 9 Narrowbody 67179 LEAP - 1B28 Mar - 23 54,302,999 58,599,999 55,230,000 55,230,000 37 737 MAX 9 Narrowbody 67182 LEAP - 1B28 Mar - 23 54,302,999 58,599,999 55,230,000 55,230,000 38 737 MAX 9 Narrowbody 67579 LEAP - 1B28 Mar - 23 54,302,999 58,599,999 55,230,000 55,230,000 39 737 MAX 9 Narrowbody 67584 LEAP - 1B28 May - 23 54,505,500 58,950,234 55,320,000 55,320,000 Total $2,058,344,228 $2,198,958,888 $2,114,500,000 $2,112,175,896

22 $- $200 $400 $600 $800 Aug-22 Sep-22 Oct-22 Nov-22 Dec-22 Feb-23 Mar-23 Apr-23 May-23 737 MAX 8 737 MAX 9 B y D e li v e r y D a te: 0.5 Y e a r s A v e r a g e A g e 1 Aircraft collateral – key observations Highlights NB / WB Value Distribution 1 Collateral Value by Aircraft Type 1 1. Weighted by the LMM of the maintenance adjusted appraised base values of the aircraft as appraised by ASG, BK and mba as of March 31, 2023 . LMM ($mm) Narrowbody (39), 100% 737 MAX 8 (22), 56% 737 MAX 9 (17), 44% ▪ The fleet types in this transaction represent United’s next generation mission critical airframe types ▪ The 100% concentration of narrowbody aircraft is the largest concentration of new/like - new narrowbody aircraft in any United EETC offering

23 16.7 1.6 2.7 0.5 0.4 0.0 2.0 4.0 6.0 8.0 10.0 12.0 14.0 16.0 18.0 Fleet 737 MAX 8 737 MAX 9 737 MAX 8 737 MAX 9 Aircraft collateral significance to United’s fleet 1. Weighted by the LMM of the maintenance adjusted appraised base values of the aircraft as appraised by ASG, BK and mba as of March 31, 2023 2. Source: United Airlines ▪ The aircraft types in this transaction represent United’s next generation of mission critical airframe types; deal collateral co nsists of recently delivered aircraft that are among United’s youngest aircraft within its respective sub - fleets ▪ The 737 MAX are critical to United’s fleet rejuvenation strategy and compare favorably vs. various older 737 variants – New technologies on the MAX aircraft include advanced technology winglet, efficient engine architecture and superior aerodyna mic s – The Boeing 737 MAX provides superior economic performance – the LEAP - 1B engine contributes to better fuel efficiency and lower operating costs, advanced technology winglets reduce fuel burn and revised tail reduces drag ▪ United currently has a fleet with the average age of 16.7, with the UAL transaction having a much lower average age of 0.5 1 Collateral vs. Fleet Age (years) 2 Aircraft Type % of Total Fleet 2 A319 9.3% A320 11.4% 737 - 700 4.6% 737 - 800 16.2% 737 - 900 1.4% 737 - 900ER 15.7% 737 MAX 8 3.7% 737 MAX 9 5.5% 757 - 200 RR 4.6% 757 - 300 2.4% 767 - 300ER 4.3% 767 - 400ER 1.8% 777 - 200 2.2% 777 - 200ER GE 2.5% 777 - 200ER PW 3.8% 777 - 300ER 2.5% 787 - 8 1.4% 787 - 9 4.4% 787 - 10 2.2% Existing Fleet UAL 2023 - 1

24 737 MAX – leading fuel efficiency advancements New technologies on the MAX family include advanced winglets, efficient engine architecture and superior aerodynamics. The LE AP engines facilitate a material portion of the efficiency and CO2 emissions improvements. Advanced Technology Winglets More Efficient Seating Options Nacelle Chevrons Laminar Flow Nacelles Advanced Avionics R eduction i n fuel and CO 2 emissions 50% reduction i n noise footprint LEAP - 1B Engine Aerodynamic aft body High Bypass Ratio Engines 737 MAX Technology minimizes noise and emissions (compared with 737NG) 1 1. The Boeing Company 2. Assumes 800 nautical mile trip in 2020 U.S Dollars on a two - class seating configuration (162 seats 737 - 800W, 150 seats A320ceo a nd 162 seats 737 - MAX 8) 3. Assumes 800 nautical mile trip in 2020 U.S Dollars on a two - class seating configuration (178 seats 737 - 900ER, 150 seats A320ceo, 178 seats 737 - MAX 9) 737 MAX 8 Fuel Efficiency (Per Seat ) 2 737 MAX 8 over 737 - 800W 737 MAX 8 over A320ceo - 15% Lower % Fuel use per seat - 17% 737 MAX 9 Fuel Efficiency (Per Seat ) 3 737 MAX 9 over 737 - 900ER 737 MAX 9 over A320ceo - 15% Lower % Fuel use per seat - 20%

Appendix A Additional Aircraft Characteristics

26 Sources: The Boeing Company; United Airlines, Inc.; FlightGlobal The Boeing 737 MAX 8 is the second largest variant of the 737 MAX family currently in service ▪ Large single - aisle, transcontinental range narrowbody aircraft ▪ High degree of commonality with other MAX family aircraft – Same pilot pool and type rating – Significant order book exists for 737 MAX 8 aircraft with over 2,200 orders ▪ Expected to contribute up to 8% better fuel efficiency and 7% lower operating costs relative to current - gen competition – New LEAP - 1B engine, MAX AT winglet, revised tail cone and 787 low - drag engine installation technology ▪ 737 MAX 8 currently has 649 aircraft in service Boeing 737 MAX 8 aircraft characteristics Top 5 Boeing 737 MAX 8 Customers (disclosed) Boeing 737 MAX liquidity / market update ▪ The Boeing 737 MAX family is a LEAP re - engined development of the 737NG – Key orders from large LCCs and major US carriers – Good regional distribution of orders – CFM International LEAP is the sole engine type ▪ 737 MAX 8 provides continuity to best - selling 737 - 800 along with 14% fuel savings ▪ Deliveries from stockpile and from line, with over 480 MAX aircraft shipped since December 2020 restart Boeing 737 MAX 8 fleet distribution (in service / on order) Importance to United ▪ 737 MAX 8 is United’s newest sub - fleet type and a key component of the ‘United Next’ growth strategy, helping expand its fleet and up - gauge on routes across its network ▪ Accommodates 166 passengers in two - class configuration (same as United’s 737 - 800 aircraft) ▪ Equipped with new signature interior featuring larger overhead bins, seatback inflight entertainment, Bluetooth connectivity, LED mood lighting, and high - speed Wi - Fi ▪ Viewed as strong and versatile replacement for United’s aging Airbus and 757 narrowbody fleets United Boeing 737 MAX 8 details Operator Quantity Southwest Airlines 464 Ryanair 164 United Airlines 132 American Airlines 130 SpiceJet 130 Total 1,020 General Spec: Aircraft Type 73 7 MAX 8 Winglets (Advanced Technology ) Yes Automatic Approach and Landing Certificate CA T IIIA Extended Twin - Engine Operations (ETOPS) 180 minutes Engine Type / Thrust LEAP - 1B28 APU Manufacturer Honeywell Brakes and Wheels Manufacturer / Type Safran / Carbon Weights and Capacities: Maximum Taxi Weight (MTW) 182,700 lbs Maximum Take - Off Weight (MTOW) 182,200 lbs Maximum Landing Weight (MLW) 152,800 lbs Maximum Zero Fuel Weight (MZFW) 145,400 lbs Fuel Capacity 6,820 US gallons Cargo Capacity (max volume) 1,540 ft 3 Asia Pacific , 33% North America , 33% Europe , 19% Latin America , 7% Other , 8%
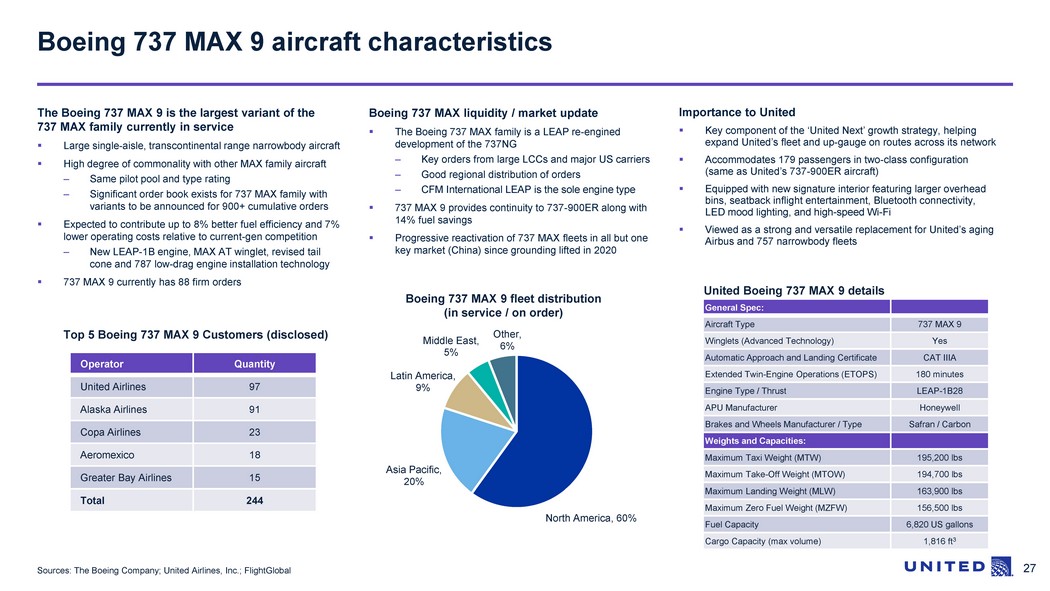
27 Sources: The Boeing Company; United Airlines, Inc.; FlightGlobal The Boeing 737 MAX 9 is the largest variant of the 737 MAX family currently in service ▪ Large single - aisle, transcontinental range narrowbody aircraft ▪ High degree of commonality with other MAX family aircraft – Same pilot pool and type rating – Significant order book exists for 737 MAX family with variants to be announced for 900+ cumulative orders ▪ Expected to contribute up to 8% better fuel efficiency and 7% lower operating costs relative to current - gen competition – New LEAP - 1B engine, MAX AT winglet, revised tail cone and 787 low - drag engine installation technology ▪ 737 MAX 9 currently has 88 firm orders Boeing 737 MAX 9 aircraft characteristics Boeing 737 MAX liquidity / market update ▪ The Boeing 737 MAX family is a LEAP re - engined development of the 737NG – Key orders from large LCCs and major US carriers – Good regional distribution of orders – CFM International LEAP is the sole engine type ▪ 737 MAX 9 provides continuity to 737 - 900ER along with 14% fuel savings ▪ Progressive reactivation of 737 MAX fleets in all but one key market (China) since grounding lifted in 2020 Boeing 737 MAX 9 fleet distribution (in service / on order) Importance to United ▪ Key component of the ‘United Next’ growth strategy, helping expand United’s fleet and up - gauge on routes across its network ▪ Accommodates 179 passengers in two - class configuration (same as United’s 737 - 900ER aircraft) ▪ Equipped with new signature interior featuring larger overhead bins, seatback inflight entertainment, Bluetooth connectivity, LED mood lighting, and high - speed Wi - Fi ▪ Viewed as a strong and versatile replacement for United’s aging Airbus and 757 narrowbody fleets Top 5 Boeing 737 MAX 9 Customers (disclosed) Operator Quantity United Airlines 97 Alaska Airlines 91 Copa Airlines 23 Aeromexico 18 Greater Bay Airlines 15 Total 244 United Boeing 737 MAX 9 details General Spec: Aircraft Type 73 7 MAX 9 Winglets (Advanced Technology ) Yes Automatic Approach and Landing Certificate CA T IIIA Extended Twin - Engine Operations (ETOPS) 180 minutes Engine Type / Thrust LEAP - 1B28 APU Manufacturer Honeywell Brakes and Wheels Manufacturer / Type Safran / Carbon Weights and Capacities: Maximum Taxi Weight (MTW) 195,200 lbs Maximum Take - Off Weight (MTOW) 194,700 lbs Maximum Landing Weight (MLW) 163,900 lbs Maximum Zero Fuel Weight (MZFW) 156,500 lbs Fuel Capacity 6,820 US gallons Cargo Capacity (max volume) 1,816 ft 3 North America , 60% Asia Pacific , 20% Latin America , 9% Middle East , 5% Other , 6%

Appendix B United’s Fleet & EETC Program

29 Position of Series 2023 - 1 collateral in United’s fleet 1 1. Number of aircraft in United’s operating fleet projected as of March 31, 2023. Source: United Airlines, Inc. 2. Includes one additional 737 MAX 9 and two additional 737 MAX 8 aircraft that are part of 2023 - 1 EETC collateral pool but were not yet delivered to United as of March 31, 2023 Existing Fleet UAL 2023 - 1 Aircraft Vintage Snapshot on March 31, 2023 1 Pre 2004 2004 2005 2006 2007 2008 2009 2010 2011 2012 2013 2014 2015 2016 2017 2018 2019 2020 2021 2022 2023 2 # in Fleet 787 - 10 13 8 21 787 - 9 25 3 10 38 787 - 8 12 12 777 - 300ER 22 22 777 - 200ER 51 2 2 55 777 - 200 19 19 767 - 400ER 16 16 767 - 300ER 38 38 757 - 300 21 21 757 - 200 40 40 737 MAX 9 30 8 10 2 7 57 737 MAX 8 16 1 15 8 7 47 737 - 900ER 136 136 737 - 900 12 12 737 - 800 105 12 13 11 141 737 - 700 40 40 A320 - 200 94 2 96 A319 - 100 81 81 ERJ - 175LL 45 45 ERJ - 175LR 30 24 54 ERJ - 145XR 100 100 CRJ - 550 23 8 31 1,122

30 United’s EETC Program Class Distribution Outstanding 1 Values in mm ▪ United currently has $10,471.3 1 million of outstanding EETC debt as of June 1, 2023 ▪ In the past, United frequently financed widebody aircraft, however, in the 2023 - 1 EETC there is a 100% concentration of new narrowbody aircraft, more specifically 737 MAX 8 / 9 ▪ The fleet types in this transaction represent United’s next generation mission critical airframe types; the deal collateral consists of brand - new aircraft or are among United’s youngest aircraft within the respective sub - fleets UAL 2023 - 1 UAL 2020 - 1 4 UAL 2019 - 2 UAL 2019 - 1 UAL 2018 - 1 UAL 2016 - 2 UAL 2016 - 1 UAL 2015 - 1 UAL 2014 - 2 UAL 2014 - 1 UAL 2013 - 1 UAL 2012 - 2 UAL 2012 - 1 Class AA Balance -- -- $603.1 $537.5 $531.1 $451.5 $517.2 $220.7 -- -- -- -- -- Class A Balance $1,320.1 $2,156.1 $244.7 $222.6 $202.3 $200.8 $230.0 -- $477.8 $413.9 $416.5 $375.1 $382.4 Class B Balance -- $411.0 $152.2 -- $132.1 $124.9 $147.7 -- -- -- -- -- -- Aircraft Age ( yrs ) 2 0.5 20.9 3.5 4.3 5.3 6.1 6.6 7.6 8.2 8.7 9.3 10.2 11.1 Collateral Breakdown 3 82% 18% 22% 58% 20% 29% 71% 14% 86% 27% 73% 33% 67% 49% 31% 20% 70% 30% 70% 30% 61% 39% Narrowbody Widebody Regional $mm 1. Source: Bloomberg as of June 1, 2023, inclusive of the UAL 2023 - 1 transaction 2. Aircraft Age is as of June 1, 2023 3. Weighted by the appraised values of the aircraft as appraised by mba as of May 2023 4. Collateral breakdown is as of Class B issuance date February 1, 2021 Tier I Aircraft 30% Tier II Aircraft 37% Spares 33% 36% 41% 23% Class AA , $2,861.2 Class A , $6,642.3 Class B , $967.9 100%

Appendix C Reconciliation of GAAP to Non - GAAP financial measures

32 ▪ United evaluates its financial performance utilizing various accounting principles generally accepted in the United States of America (GAAP) and Non - GAAP financial measures, including adjusted earnings before interest, taxes, depreciation and amortization (adjusted EBITDA) and rent (adjusted EBITDAR), adjusted EBITDA margin, adjusted pre - tax income (loss), adjusted net income (loss) and adjusted pre - tax margin. UAL believes that adjusting for special charges (credits), unrealized (gains) losses on investments, net and other adjustments is useful to investors because these items are not indicative of UAL's ongoing performance. United also provides financial metrics, including adjusted total debt and adjusted net debt, that we believe provide useful supplemental information for management and investors. Reconciliation of GAAP to Non - GAAP financial measures

33 Reconciliation of GAAP to Non - GAAP financial measures Adjusted Total Debt and Adjusted Net Debt (in millions) March 31, 2023 December 31, 2022 December 31, 2021 December 31, 2020 December 31, 2019 December 31, 2018 Current maturities of long-term debt 3,206$ 2,911$ 3,002$ 1,911$ 1,407$ 1,230$ Current maturities of finance leases 75 104 76 182 46 123 Current maturities of operating leases 610 561 556 612 686 719 Current maturities of other financial liabilities 29 23 834 18 - - Long-term debt 27,460 28,283 30,361 24,836 13,145 12,215 Long-term obligations under finance leases 105 115 219 224 220 224 Long-term obligations under operating leases 4,569 4,459 5,152 4,986 4,946 5,276 Other financial liabilities 1,130 844 863 1,140 - - Noncurrent postretirement benefit liability 658 671 1,000 994 789 1,295 Noncurrent pension liability 778 747 1,920 2,460 1,446 1,576 Adjusted total debt (Non-GAAP) 38,620 38,718 43,983 37,363 22,685 22,658 Less: cash and cash equivalents (7,634) (7,166) (18,283) (11,269) (2,762) (1,694) Less: short-term investments (9,522) (9,248) (123) (414) (2,182) (2,256) Adjusted net debt (Non-GAAP) 21,464 22,304 25,577 25,680 17,741 18,708
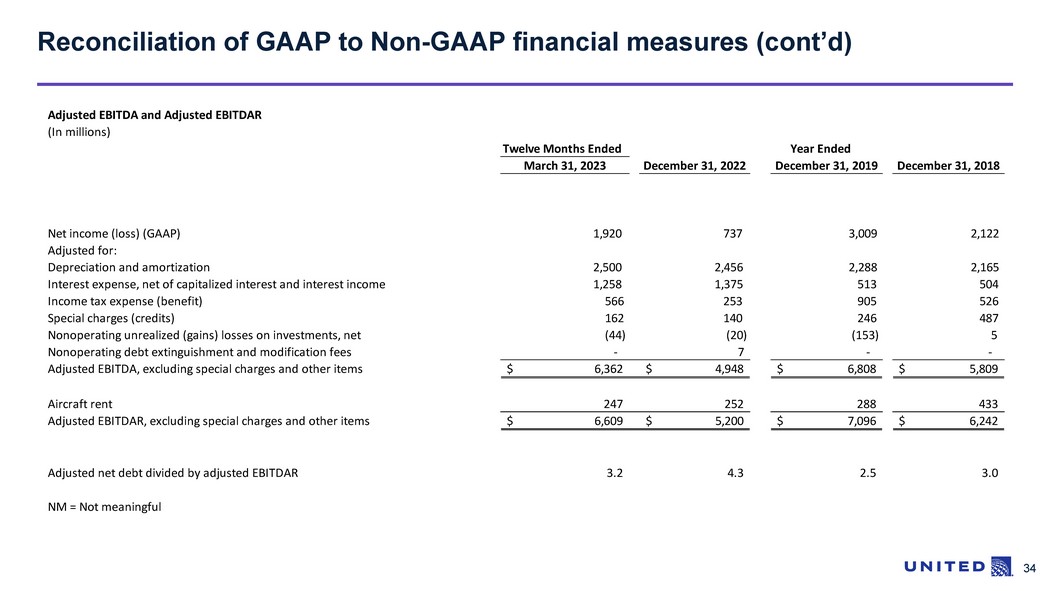
34 Reconciliation of GAAP to Non - GAAP financial measures (cont’d) Adjusted EBITDA and Adjusted EBITDAR (In millions) Twelve Months Ended March 31, 2023 December 31, 2022 December 31, 2019 December 31, 2018 Net income (loss) (GAAP) 1,920 737 3,009 2,122 Adjusted for: Depreciation and amortization 2,500 2,456 2,288 2,165 Interest expense, net of capitalized interest and interest income 1,258 1,375 513 504 Income tax expense (benefit) 566 253 905 526 Special charges (credits) 162 140 246 487 Nonoperating unrealized (gains) losses on investments, net (44) (20) (153) 5 Nonoperating debt extinguishment and modification fees - 7 - - Adjusted EBITDA, excluding special charges and other items 6,362$ 4,948$ 6,808$ 5,809$ Aircraft rent 247 252 288 433 Adjusted EBITDAR, excluding special charges and other items 6,609$ 5,200$ 7,096$ 6,242$ Adjusted net debt divided by adjusted EBITDAR 3.2 4.3 2.5 3.0 NM = Not meaningful Year Ended

35 Reconciliation of GAAP to Non - GAAP financial measures (cont’d) Adjusted pre-tax income and adjusted pre-tax margin (In millions) Second Half 2022 Total Operating Revenue 25,277$ Pre-tax income (loss) (GAAP) 2,283$ Adjusted to exclude: Special charges (credits) 36 Unrealized (gains) losses on investments, net (60) Debt extinguishment and modification fees - Adjusted pre-tax income (Non-GAAP) 2,259$ Pre-tax margin 9.0% Adjusted pre-tax margin (Non-GAAP) 8.9%


